Page 16. An /ŋ/-initial word was erroneously coded as /n/-initial in the word list file that was joined with the production data. In this correction we update the analyses and provide new values and figures for the merger. We report these corrections with some of the original context.
Correction of this error alters the exact values reported for the initial two-raters inter-rater reliability for the /n/- and /ŋ/-initial words, which are reported in an updated version of Table 5. The italicized values indicate a change from the original text.
Inter-rater reliability measures for the auditory coding of critical items from the perspective of the historical phoneme.
| Historical Phoneme | Number of Items Coded | Kappa Statistic | p-value | Percentage Agreement |
| l | 1067 | 0.82 | < 0.001 | 95.9% |
| n | 1060 | 0.84 | < 0.001 | 91.2% |
| m̩ | 801 | 0.48 | < 0.001 | 92.5% |
| ŋ̩ | 801 | 0.46 | < 0.001 | 79.3% |
| Ŋ | 1065 | 0.64 | < 0.001 | 84.6% |
| vowel onset | 1068 | 0.59 | < 0.001 | 81% |
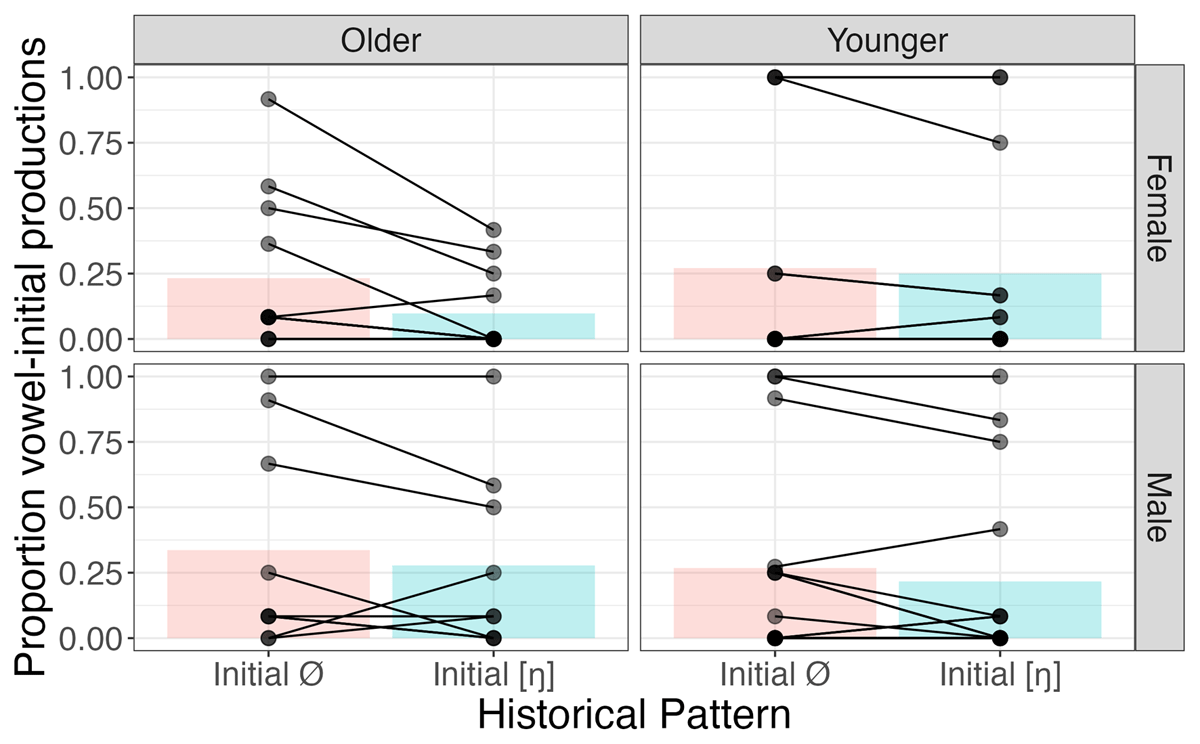
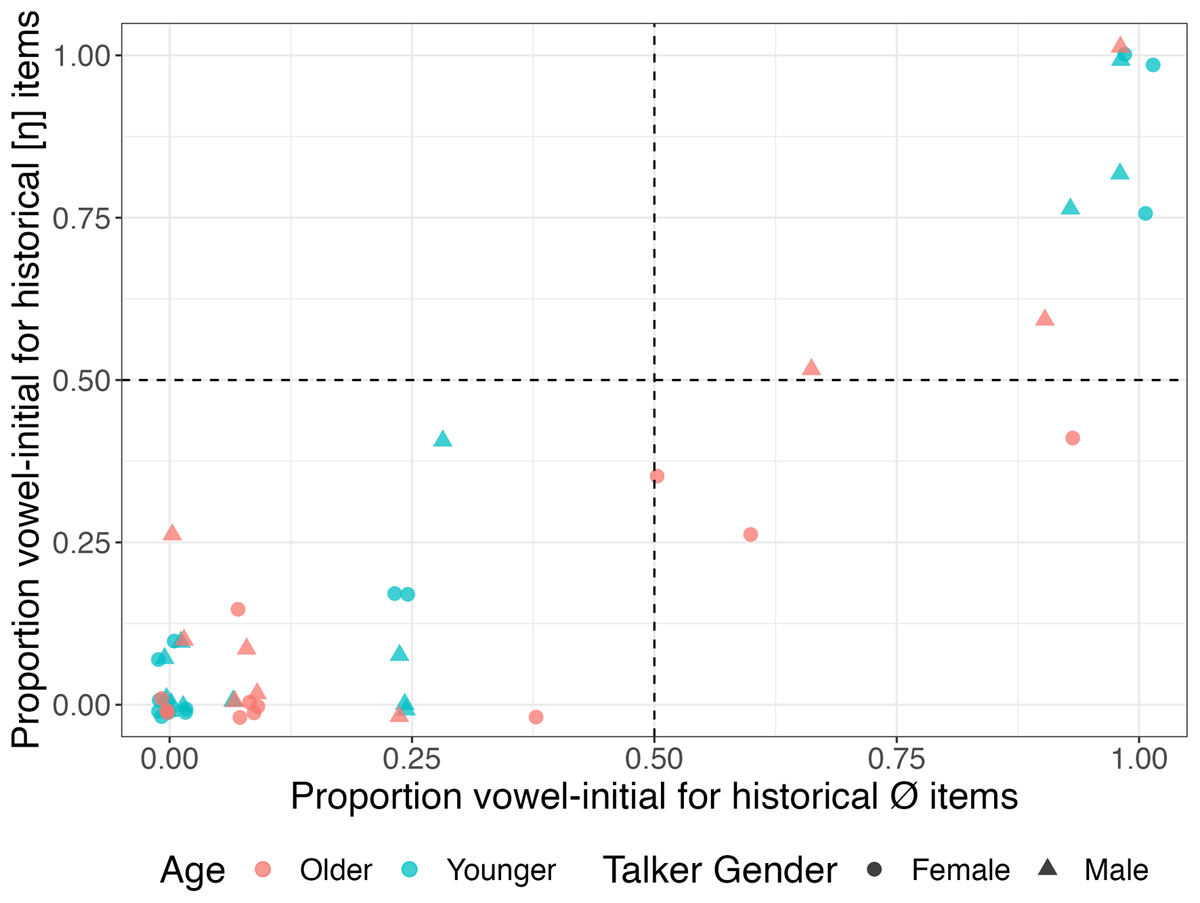
Page 22. The section for the production results for the [ŋ]↔Ø merger in 3.1.3 are updated here. The amount of production data for the [ŋ]↔Ø merger is increased (n = 1170). Adjustments for the regression model output (Table 8), group-level visualization (Figure 6), and individual scatterplot (Figure 7) are presented.
Model output for vowel initial and initial [ŋ] merger in production. Significant factors (α level = 0.05) are bolded.
| B | Standard Error | z-value | p-value | |
| Intercept | –2.5137 | 0.6213 | –4.046 | 5.21e–05 |
| Historical Pattern | 0.3530 | 0.3000 | 1.1770 | 0.239 |
| Age Group | 0.2529 | 0.5574 | 0.4540 | 0.650 |
| Gender | 0.5627 | 0.55640 | 1.0110 | 0.312 |
| Historical Pattern: Age Group | 0.1576 | 0.1363 | 1.1570 | 0.247 |
| Historical Pattern: Gender | 0.02157 | 0.1406 | –0.1530 | 0.878 |
| Age Group: Gender | 0.4777 | 0.5540 | 0.8620 | 0.389 |
| Historical Pattern: Age Group: Gender | –0.1472 | 0.1430 | –1.0300 | 0.303 |
Group means and individual data points for proportion vowel-initial productions for historically [ŋ]- and null-initial words, faceted by age and gender. The lines connecting data points connect values for an individual. The shading of the individual points is to allow the visualization of individual overlap.
Proportion vowel-initial productions for historically [ŋ]-initial items (y-axis) and historically null-initial items (x-axis) for each individual. Women are plotted with circles and men with triangles. Older speakers are in red and younger speakers in blue. The values have been jittered to minimize overlap.
The most relevant change is that the historical pattern is not statistically significant (p = 0.239), meaning there is no clear evidence of group-level contrast between [ŋ] and null-initial (Table 8). This is consistent with individual-level patterning where none show robust contrastiveness (Figure 6). Visual interpretation of Figure 7 does not change: Although the corrected data show two more older individuals merging towards null (top right quadrant), younger speakers are still the majority of individuals merged towards null as six of the nine participants are younger.
Comparing across the three mergers, [ŋ]↔Ø is the only one that does not maintain clear patterns of community-wide contrast.
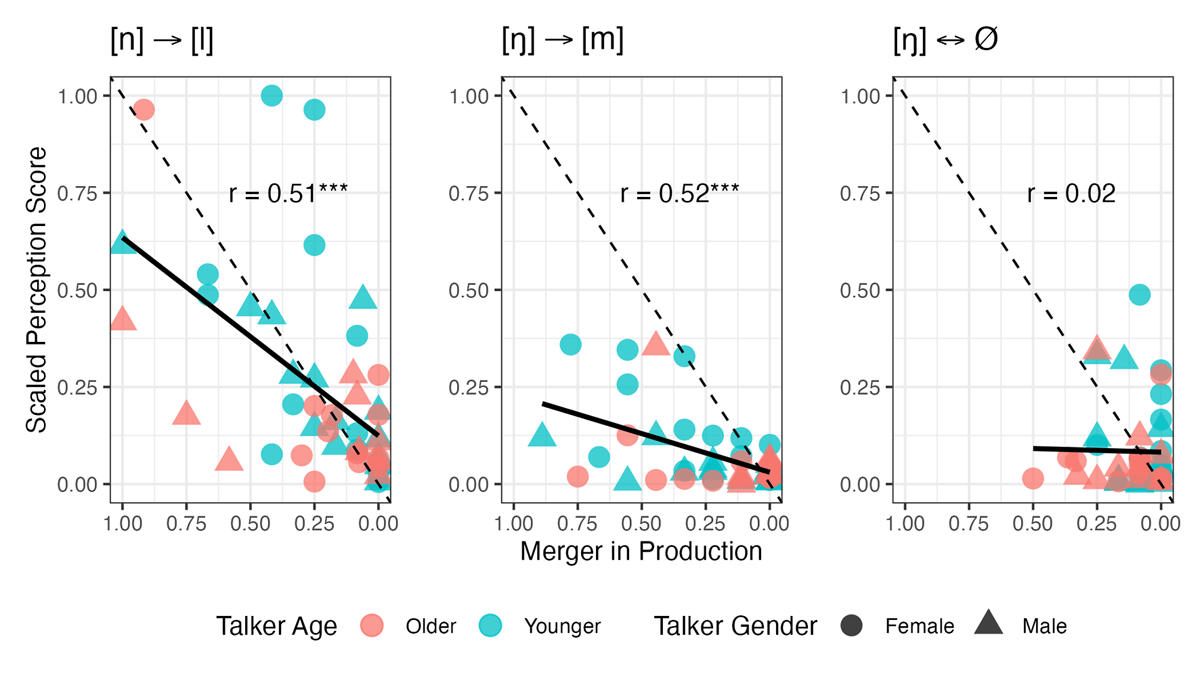
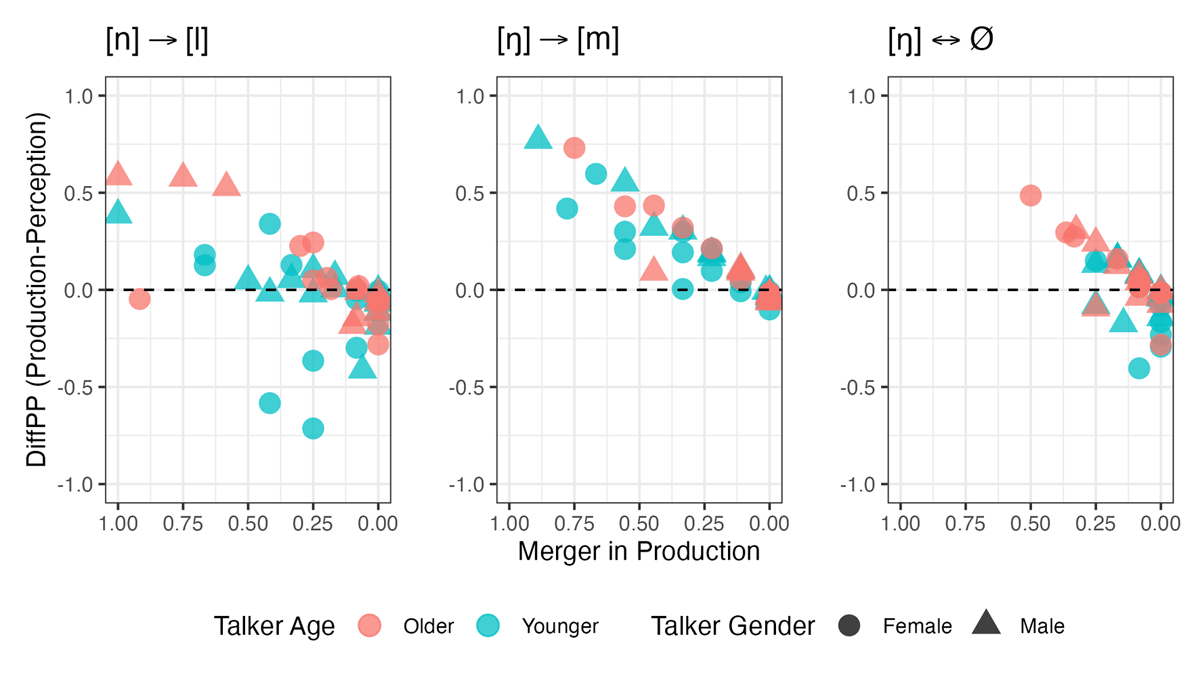
Page 32. We provide an updated Figure 15 that provides unchanged panels for the [n]→[l] and [ŋ̩]→[m̩] mergers, but are presented with the corrected panel for [ŋ]↔Ø merger to facilitate comparisons across the mergers. As before, there was no relationship between merger in perception and production for the [ŋ]↔Ø merger [t(47) = –0.14, r = 0.02, p = 0.89]. Figure 16 presents the direction of misalignment within an individual for each merger, though the values in the third panel for the [ŋ]↔Ø merger are the only ones that have been updated.
Degree of merger in perception (y-axis) versus production (x-axis) for the three mergers. Merger in perception is the absolute value of category crispness and the merger in production is quantified as the absolute value of the difference in the proportions of the novel pronunciation for the two lexical sets for each merger. The range of the x-axis is from 1 (fully contrastive) to 0 (fully merged) to reflect the time course of change. The solid lines represent fitted lines to the data while the dashed lines represent a hypothetical fitted line if production and perception were perfectly correlated.
DiffPP scores, calculated as the difference of production and perception measures (y-axis) versus production (x-axis, reversed) for the three mergers. DiffPP scores above zero represent individuals whose production is more contrastive (less merged) than perception while scores below zero represent individuals whose perception is more contrastive (less merged) than production.
Page 39. Table 14 updates the full set of findings for [ŋ-]↔Ø. The changes are noted in red font. What changes here is that, with the correction, we find no evidence in the lexical classes contrasting in production at the community level. This indicates that the community-level production-perception relationship is mismatched. At the individual level, there are some small adjustments to the number of individuals who adhere to the particular patterns, but the overall lack of a production-perception correlation at the individual level is maintained, though the actual statistical values need small adjustments.
Summary of results for [ŋ-]↔Ø. Individual productions patterns (n=49) are described based on their proportion of Ø for /ŋ-/ as either innovative (>0.75), variable (0.75–0.25), or conservative (<0.25); if proportion of Ø for Ø- was under 0.5, individuals were instead described as hypercorrective. Individual perception patterns (n=51) are described based on scaled category crispness scores as merged (<0.25), intermediate (0.25–0.75), or categorical (>0.75).
| Production (PROD) | Perception (PERC) | Production-Perception | ||
| Community | Overall | [ŋ]-variant more likely than Ø | [ŋ]-variant more likely than Ø | • PROD and PERC are overall mismatched |
| Lexical classes | No contrast between Ø and /ŋ/ | Contrast between Ø and /ŋ/ | ||
| Age | None | Trend towards younger more contrastive than older | ||
| Gender | None | None | ||
| Individual | Overall | • Few (n = 7, 14%) use mainly Ø for both (innovative) • Few (n = 5, 10%) use mainly Ø for both somewhat variably • Most (n = 37, 76%) use mainly [ŋ] for both (hypercorrective) |
• Majority (n = 50, 98%) had little to no contrast (merged) • Few (n = 1, 2%) had intermediate contrast • None had close to discrete contrast (categorical) |
• PROD and PERC are overall not correlated (r = 0.02) When misaligned: • Perception leads early: Those who contrast more in PROD tend to contrast relatively less in PERC • Perception lags late: Those who contrast less in PROD tend to contrast relatively more in PERC
|
| Age | None | Those most contrastive are generally younger | ||
| Gender | None | None |
Page 41. We update the language surrounding the overall status of this merger in production: For the [ŋ]↔Ø merger, the data suggest that all groups produce less null-initial for both historical categories, at a mean rate of 24% null (i.e., 76% [ŋ]). No one robustly maintains the contrast in production.
Competing interests
The authors have no competing interests to declare.


