1. Introduction
Complexity in phonology refers to a set of elements that constitute a language system and how these elements are hierarchically organized within it (cf. Gierut, 2007, and references therein). It is thus an intrinsic property of the phonology of a language since every sound system is composed of several constituents dominated by higher level constituents. At the word-level phonology, these are features, segments, syllables, feet, and prosodic words. This architecture was originally designed to account for the organization of spoken language phonology but it also largely reflects the organization of the sign language perceptual-articulatory system (e.g., Brentari, 2019), calling for an amodal spoken-sign language phonology, at least at the level of the foundation elements (e.g., binary features hierarchically organized, natural classes, weight units, syllables, etc.).
Complexity has been mostly investigated under two approaches in spoken phonology (cf. Chitoran & Cohn, 2009, for a review.) On the one hand, a model-driven account of complexity uses the number of constituents of a (sound) system as a metric. Depending on the specific metric, these constituents are conceived in terms of distinctive features (Anderson & Ewen, 1987; Chomsky & Halle, 1968; Clements, 1985; Lehmann, 1974; Sagey, 1986); in other cases they are defined in terms of segments and syllables (see Maddieson, 2005a, 2005b, 2009; Maddieson, Bhattacharya, Smith, & Croft, 2011; van der Hulst, 2020); Easterday (2019) for a typological approach to complexity; Marsico, Maddieson, Coupé, and Pellegrino (2004) for a computational-based account. Under this view, complexity is related to the notion of markedness (Trubetzkoy, 1969): A form presenting a marked phonological specification is more complex than a form without it. On the other hand, there are approaches that make use of, for example, speech errors (e.g., Meyer, 1992; Slis, 2018; Wells-Jensen, 2007, for a review), or frequency (e.g., Romani, Galuzzi, Guariglia, & Goslin, 2017), as diagnostics for phonological complexity. Under this other view, complexity is typically related to the notion of articulatory effort which crucially affects the rate of speech errors and shapes the patterns of acquisition (cf. Donegan & Stampe, 1979; Kirchner, 2001, for a formal approach). Under this kind of approach, complexity is intended in articulatory terms, hence the notion of effort is conceived as a sort of diagnostic for markedness: forms that are harder to articulate are more marked than forms that are easier to articulate. Ideally, these two views of complexity should converge, making a theoretical model of phonological systems a good predictor of the articulatory effort (but see Goldrick & Daland, 2009).
A similar scenario holds for sign language phonology, where model-driven approaches identify complexity in various ways, by counting the number of nodes required to accurately represent a form (e.g., the Prosodic Model by Brentari, 1998, p. 214), by referring to more global properties of signs (e.g., one-handed signs versus two-handed signs, symmetry of form, etc. as in Battison, 1978), or by using a physiological metric to compute effort as in the Ease of Articulation model by Ann (1996; 2006).
As for experimental approaches to sign phonology, several studies identified a variety of factors that may reveal the complexity of a sign, including accuracy in repetition tasks (Ortega & Morgan, 2015), error rates in production tasks (Thompson, Emmorey, & Gollan, 2005), frequency of a particular form (Ann, 1996) and lexical access (Orfanidou, Adam, McQueen, & Morgan, 2009).
In particular, works on sign production focusing on articulatory effort (e.g., Emmorey, Bosworth, & Kraljic, 2009; Mann, Marshall, Mason, & Morgan, 2010) have shown that articulation accuracy differs across the four phonological classes (i.e., handshape, location, orientation, and movement). Ortega and Morgan (2015) showed that the overall structure of a sign contributes to its phonological complexity such that signs with multiple components are more complex than signs that do not have multiple components (e.g., two-handed signs are harder to produce than one-handed signs).1
As we will shortly see, while these error-driven studies converge in identifying handshape as the most complex component of a sign, no study to our knowledge has tried to systematically investigate whether articulation errors derive from the intrinsic complexity of a particular phonological class and, if so, which one is responsible for the overall complexity of a sign. In other words, no study has tried to predict error-driven complexity of signs from a model-driven measure of complexity. The goal of this study is precisely to fill in this gap by comparing an error-driven measure of complexity based on error rates with a measure of complexity as derived from a specific phonological/phonetic model of word-level phonology for signs. In doing so, we will obtain a validated model-driven measure of articulatory complexity derived from the phonetic components of signs organized in a feature geometry.
Highly detailed feature-based models (e.g., the Prosodic Model [Brentari, 1998], the Dependency Model [van der Hulst, 1993], the Hand-Movement model [Sandler, 1986]) are designed to capture (the frequency of) patterns found in the phonotactics of sign language lexicon, as well as aiming to account for sign language phonological processes. We hypothesize that these models are also able to capture the kind of complexity as measured in terms of effort (error rates). If we are right, we expect to find a strong correlation between error rates and number of features required to describe a sign. This correlation will be interpreted as an indication that a given model is able to capture not just the phonological system of a sign language but also the effort needed to produce signs even without any knowledge of the phonological system, hence proving additional phonetic ground to the model itself. We then investigate which phonological class among the four major ones (handshape, location, orientation, and movement) has the strongest impact in determining complexity. We expect to find a significant contribution of handshape and possibly of other phonological classes. Although this study will not provide a feature-level scale of complexity, we will interpret its results in computational terms. Specifically, hand configuration has a higher degree of freedom than other phonological classes, requiring a higher number of features hence increasing the probability of error as a consequence of both perceptual complexity (simultaneous identification of the relevant nodes) and production complexity (control of a higher number of nodes).
In the next sections, we will present studies on complexity and articulatory accuracy in sign repetition tasks (Section 2). Particular attention will be given to those studies including production from hearing non-signers (with little-to-no prior exposure to sign language). Complexity as defined by sign language phonological models will be briefly introduced in Section 3, followed by a presentation of the particular model used in this paper, namely the Prosodic Model by Brentari (1998), and arguments for the choice of this model over others in Section 4. The error-driven measure from a sign repetition task with non-signers is presented in Section 5, followed by the computation of the model-driven measure (Section 6), and finally by the comparison of the two in Section 7. Results are discussed in Section 8, where we compare the error-driven measure from the sign repetition task and with the model-driven measure of complexity. Section 9 concludes the paper.
Our study focuses on French Sign Language (LSF), a language for which phonological data is still scarce, although its impact can be easily extended to other sign languages.
2. Complexity and articulatory accuracy in sign repetition tasks
In this section we briefly report on previous studies on sign repetition tasks. These will frame the study on the error-driven measure of complexity to be presented in Section 5, and motivate the use of non-signers as a valuable population.
Several factors may contribute to articulation errors in sign production, such as perceptual saliency of the sign components (Bochner, Christie, Hauser, & Searls, 2011; Rosen, 2004, for converging evidence), size inventory (Hohenberger, Happ, & Leuninger, 2002; Marshall, Mann, & Morgan, 2011), the complexity of mastering a novel motor task (Mirus, Rathmann, & Meier, 2001; Rosen, 2004), age of exposure (e.g., D. P. Corina et al., 2020), frequency (Ann, 1996, 2006), and also factors related to the overall structure of a sign (e.g., one-handed signs versus two-handed signs, Battison, 1978) and to the contribution of each phonological class (Ortega & Morgan, 2015).
As for articulation accuracy, Emmorey et al. (2009), Mann et al. (2010), and Mirus et al. (2001) showed that articulation accuracy differs across the four phonological classes, the order of complexity varying according to the type of task, in line with findings on sign language acquisition (e.g., Conlin, Mirus, Mauk, & Meier, 2000) and on the tip of the fingers effect (e.g., Thompson et al., 2005). For instance, in a repetition task in Russian Sign Language involving signers of American Sign Language (ASL) and non-signers, Emmorey et al. (2009) showed that non-signing participants were least accurate in learning to reproduce handshape and most accurate in reproducing location. For movement, the performance of non-signers fell in-between that of handshape and location. They interpret the results of such error patterns (handshape as the most complex parameter) in terms of complexity in line with Brentari’s model.
Mann et al. (2010) manipulated handshape and movement to control for complexity in a repetition task of British Sign Language (BSL) pseudo-signs administered to Deaf children (native2 or early learners) and hearing non-signer children. Handshapes like  ,
,  ,
,  , and
, and  were treated as simple as opposed to more complex ones like
  ,
,  , and others from the BSL handshape inventory, while path movements were treated as simple as compared to forms with two simultaneous movements (e.g., a path movement co-occurring with a handshape change). It was found that accuracy was lowest for signs that were more complex in both Deaf and hearing children (e.g., more complex signs were more likely to be replaced with simpler signs). This study highlighted the importance of articulatory grounding in processing the linguistic content in the visual-gestural modality. Even though the phonological knowledge of Deaf signers allows them to better perform the task, phonetic complexity affects their grasping of the phonological processing of signs.
Working on a holistic definition of complexity based on Battison’s (1978) classification system, Ortega and Morgan’s (2015) classification system used a sign repetition task with hearing learners of BSL to study the effects of overall phonological complexity of signs and, separately, the influence of the four phonological classes on L2 sign acquisition. The different levels of complexity were based on the number of hands selected for the sign (one- versus two-handed signs), the behavior of the non-dominant hand when selected (identical versus different from the dominant hand), and the location of the sign (neutral space versus signer’s body). Repetitions from hearing learners were coded based on a simple incorrect/correct grid so as to obtain a score for each stimulus with one point for each correct reproduction of each parameter. Participants’ scores were compared to the global complexity level of each sign. In addition, they reported accuracy scores for each of the four phonological classes. For the overall complexity of the sign, results showed that articulation accuracy gradually decreased as the number of phonological components of a sign increased, that is one-handed signs were less complex and hence more accurately reproduced than two-handed signs. For each class, it was found that location was the easiest (i.e., the most accurately reproduced), followed by orientation, movement, and finally handshape.
To summarize, these studies show that handshape is the least accurate (i.e., more difficult to articulate) component of a sign, location is the most accurate, with movement and orientation falling in between (Ortega & Morgan, 2015); that complexity incrementally affects each subcomponent of a sign (Mann et al., 2010); and that adult signers are less prone to make phonological errors in repetition tasks than hearing non-signers and signing children (Emmorey et al., 2009; Mann et al., 2010). While a phonological explanation of the complexity of handshape over the other sign components is easy to find in current phonological models (Emmorey et al., 2009), it is less clear how to extend this explanation to cases where the effect is found in non-signers who are in principle unaware of the phonological properties of signs. We will interpret a similar finding in our work as evidence that at least part of the descriptive accuracy of phonological models is grounded in their phonetic basis.
3. Complexity through sign language models
Theoretical models account for phonological complexity based on phonetic/phonological markedness criteria. For instance, Battison (1978) formalizes sign complexity as a four-level scale ranging signs from Type-0 to Type-3 depending on the number of articulators involved and their overall behavior in the execution of the sign. Type-0 are one-handed signs, by default least marked both in terms of articulators involved and of features required to describe them (e.g., the LSF sign woman in Figure 1a). Two-handed signs are categorized based on the behavior of the non-dominant hand: Type-1 are two-handed signs with both hands acting in the exact same way, i.e., they share all four phonological classes (e.g., the LSF sign bed in Figure 1), Type-2 have the non-dominant hand static with the same handshape as the dominant one (e.g., the LSF sign subway in Figure 1c), and Type-3 have different handshapes between the two hands (e.g., the LSF sign again in Figure 1d). While the behavior of the articulators is a key factor in determining sign complexity, this metric does not separate the individual contribution of more primitive components of signs such as handshape, location, and movement and can thus only offer a preliminary and somehow rough categorization of the level of the complexity of signs. For instance, a one-handed sign with a fully closed handshape and a path movement would count as equally complex as a one-handed sign with two flexed selected fingers and a path movement with an orientation change and an aperture change.
Examples of LSF signs based on Battison’s classification (1978).
Ann’s (1996) Ease of articulation model formalizes complexity based on the physiological properties of the hand. Complexity strictly depends on articulatory/motoric ease of production, which in turn depends on the group of muscles involved in the articulation. Under this framework, markedness depends on the number of muscles involved in the articulation of a handshape or on how difficult it is to control some contractions (e.g., those leading to a bent middle or ring finger). Unfortunately, this model remains limited to handshape, without extending a similar fine-grained complexity measure to the other phonological classes.
Turning to more comprehensive models of sign phonology, several of them have been proposed in the literature since the first pioneering work by William Stokoe later republished (Stokoe, 2005). All of them share a featural approach to sign description, while differing on the specific treatment of the phonological sublexical units or more subtly in the internal organization of groups of features. For instance, the Holds-and-Movement model treats signs as composed of sequences of handshapes interpolated by transitions between locations (Liddell & Johnson, 1989). Other models are more directly inspired by spoken language theories and organize features in a hierarchical/geometrical fashion (Clements, 1985). The Hand-Tier Model (Sandler, 1986; 1993), the Dependency Phonology Model (van der Hulst, 1993; van der Hulst & van der Kooij, 2021), and the Prosodic Model (Brentari, 1998) all belong to this tradition. Amongst these only the Prosodic Model explicitly defines a direct mapping between feature representation and degree of complexity: the richer the structure, in terms of positively specified features, the more complex the sign. Hence, markedness is determined by the number of branches contained in the structure (Brentari, 1998, pp. 213–214), along the lines of Dresher and van der Hulst (1993).3
Aristodemo (2013) uses this definition of complexity to conduct a magnitude estimation study asking Italian Sign Language (LIS) Deaf signers and Italian hearing non-signers to rate a number of handshapes with respect to perceived complexity. Results showed that perceived complexity correlates with richness of the hierarchical representation and that the Prosodic Model better predicts perceived complexity than Battison’s four-level typology of signs. The study also reports some differences between the ratings of Deaf signers and hearing non-signers which are accounted for in terms of a pure phonological effect. For instance, handshapes that do not belong to the phonological inventory of LIS were rated as more complex by signers than by non-signers (e.g.,  ). Our study will apply the same rationale to evaluate whether error rates in a repetition task can be predicted by the Prosodic Model. Differently from Aristodemo (2013), we will address all phonological classes of a sign as captured by the Prosodic Model in a repetition task rather than a pure perception experimental design, and we shall only include non-signing hearing participants to avoid any phonological interference (which might have lead signers to be too accurate and reach a ceiling effect, Emmorey et al., 2009). This will be done after a brief overview of how signs are represented in the Prosodic Model.
4. The Prosodic Model: An overview
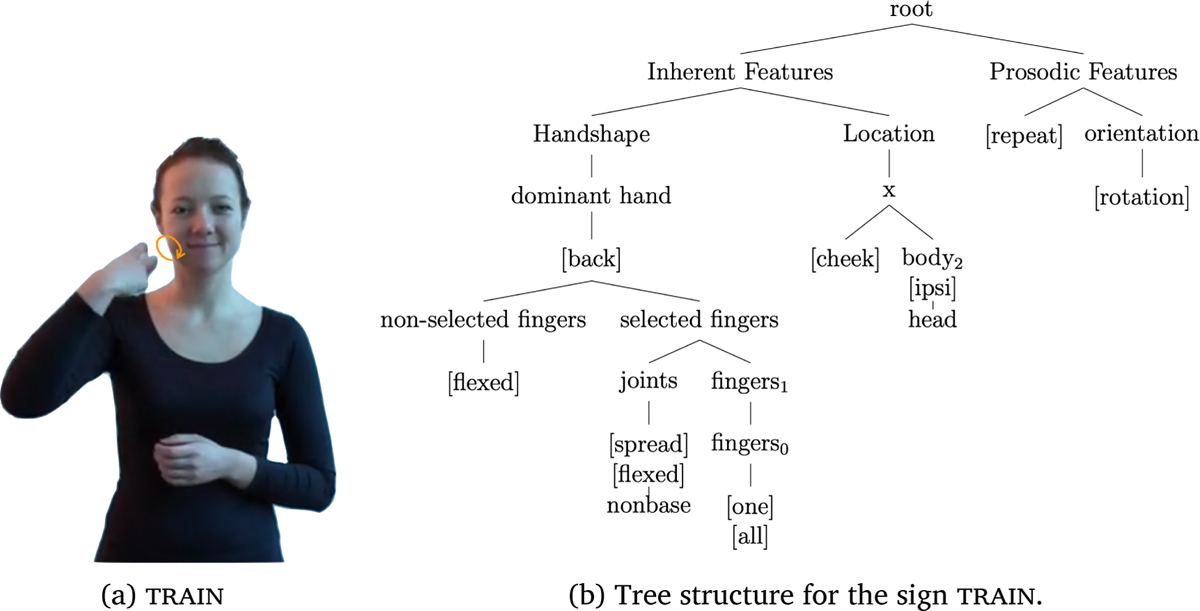
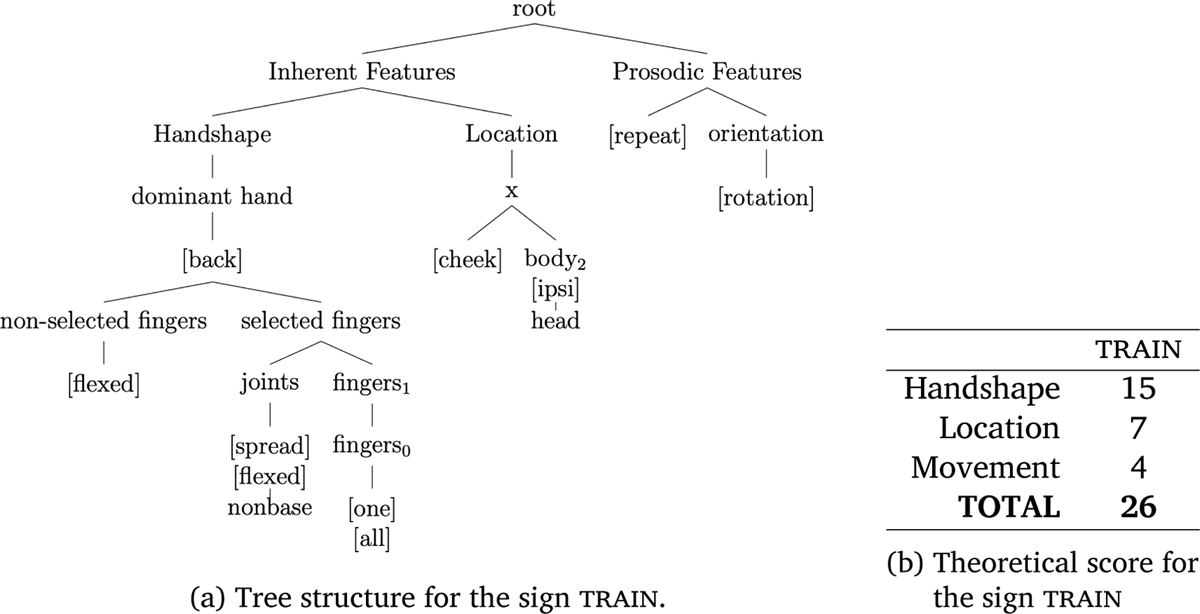
The Prosodic Model (Brentari, 1998) decomposes each sign in a hierarchical structure of organized features divided into two main branches. One branch governs those features whose status does not change during the articulation of the sign, namely the Inherent Features; the other branch governs those features that introduce a change during the articulation of the sign, namely the Prosodic Features. The sublexical units of handshape and location are part of the Inherent Feature branch; orientation is derived as a relation between a specified handpart feature and location, while the Prosodic Feature branch captures the movement component in terms of location change, orientation change, or handshape change. These are roughly corresponding to directional path movements (straight, arc, or circular), wrist rotations and pronations, and hand opening/closing. In Section 6 we use this feature approach to capture these dynamic components of signs as part of the movement category. Each branch dominates several nodes (and subbranches), while terminal nodes host contrastive features. An illustrative example is given in Figure 2, corresponding to the representation for the LSF sign train.
The sign train in LSF, and its phonological representation in the framework of the Prosodic Model (Brentari, 1998).
The tenets of feature dependency and feature geometry as in Clements (1985) and subsequent works are at the core of the Prosodic Model. This strong theoretical stand finds support in the relation between the phonetic facet and the phonological facet of a feature approach to sign description. On the one hand, each feature in the Prosodic Model has a descriptive value deeply grounded at the phonetic level. For instance, handshape features and their geometry partly subsume Ann’s Ease of Articulation model (1996, 2006), while movement features are organized in a sonority hierarchy. On the other hand, the contrastive force and the sensitivity to phonological processes provide concrete evidence of their phonological status. In its current development, the Prosodic Model counts 20 features and 28 nodes for handshape (including 12 features and 15 nodes for the dominant hand), 35 features and 12 nodes for location, and 23 features and 4 nodes for movement. From this figure, handshape and location clearly emerge as the richest phonetic/phonological classes; however, the number of possible combinations for handshape is considerably larger than for location thus explaining its higher contrastive power and higher level of complexity with respect to the other phonological classes (Emmorey et al., 2009).
In the remaining part of this section we describe how each phonological class is incorporated into the Prosodic Model, providing examples of minimal pairs in LSF. This will give the reader a concrete idea of how the model-driven measure of complexity for each sign has been computed in our study and guarantees replicability. Additionally, we provide a fully-expanded structure of the Prosodic Model, with all possible nodes and features, in Appendix D.
Handshape. The handshape branch of structure has the largest inventory due to the amount of contrastive features (Hohenberger et al., 2002). These are necessary to appropriately capture the relevant fingers of a handshape (selected versus non-selected fingers) and to identify the relation between the joints (e.g., [crossed]  versus [spread]
  ), the behavior of the thumb (selected versus non-selected, e.g.,
  versus
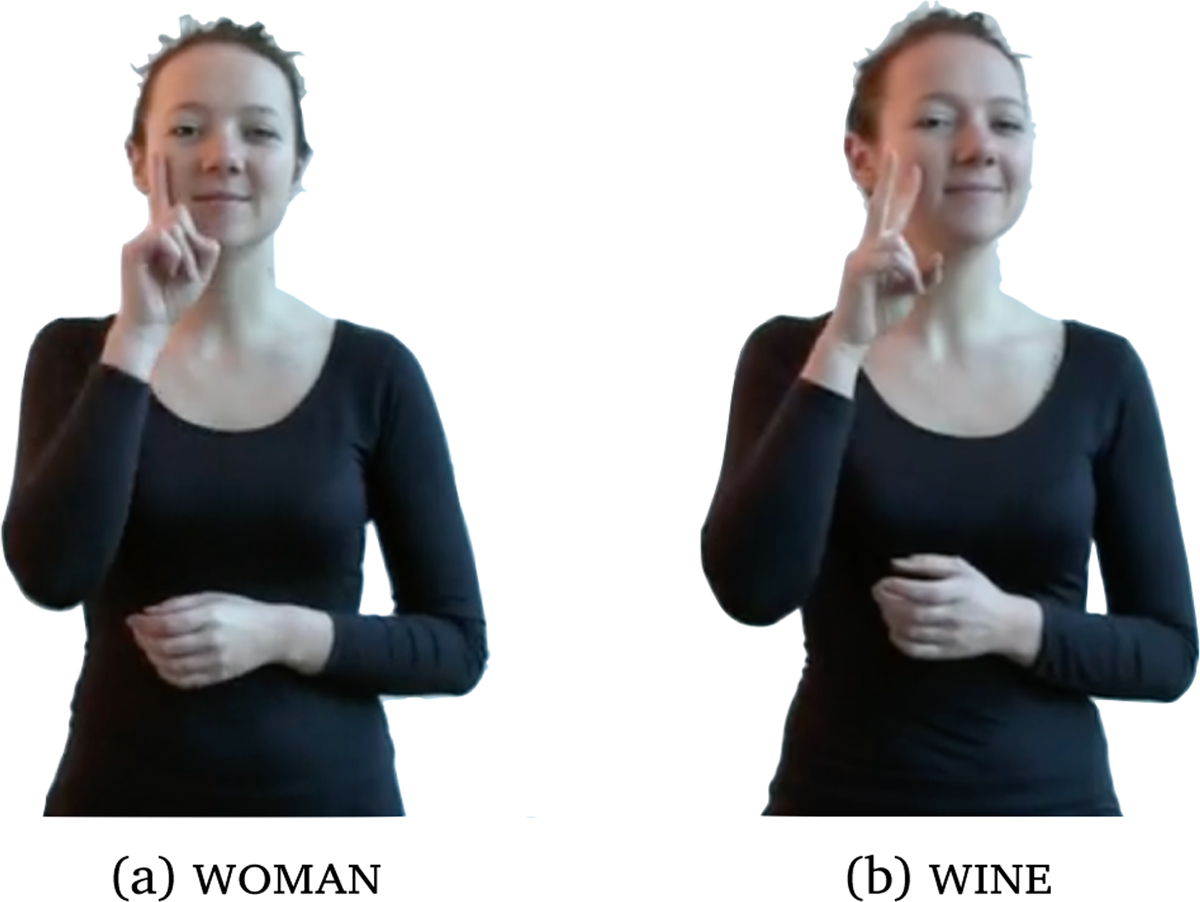
  ), etc. An example of the contrastive power of this system is illustrated by the LSF minimal pair woman ∼ wine in Figure 3. The two signs differ in the number of selected fingers (one versus two, respectively). Crucially, the model incorporates Battison’s intuition that two-handed signs increase complexity. Indeed, an H2 subbranch stemming from the Handshape node serves precisely the purpose of including the non-dominant hand, whether its shape and its behavior are similar to or different from the dominant hand. Even if not encoded as a primitive, also at the local level of the Handshape subbranch, the higher the number of features, the more complex the sign.
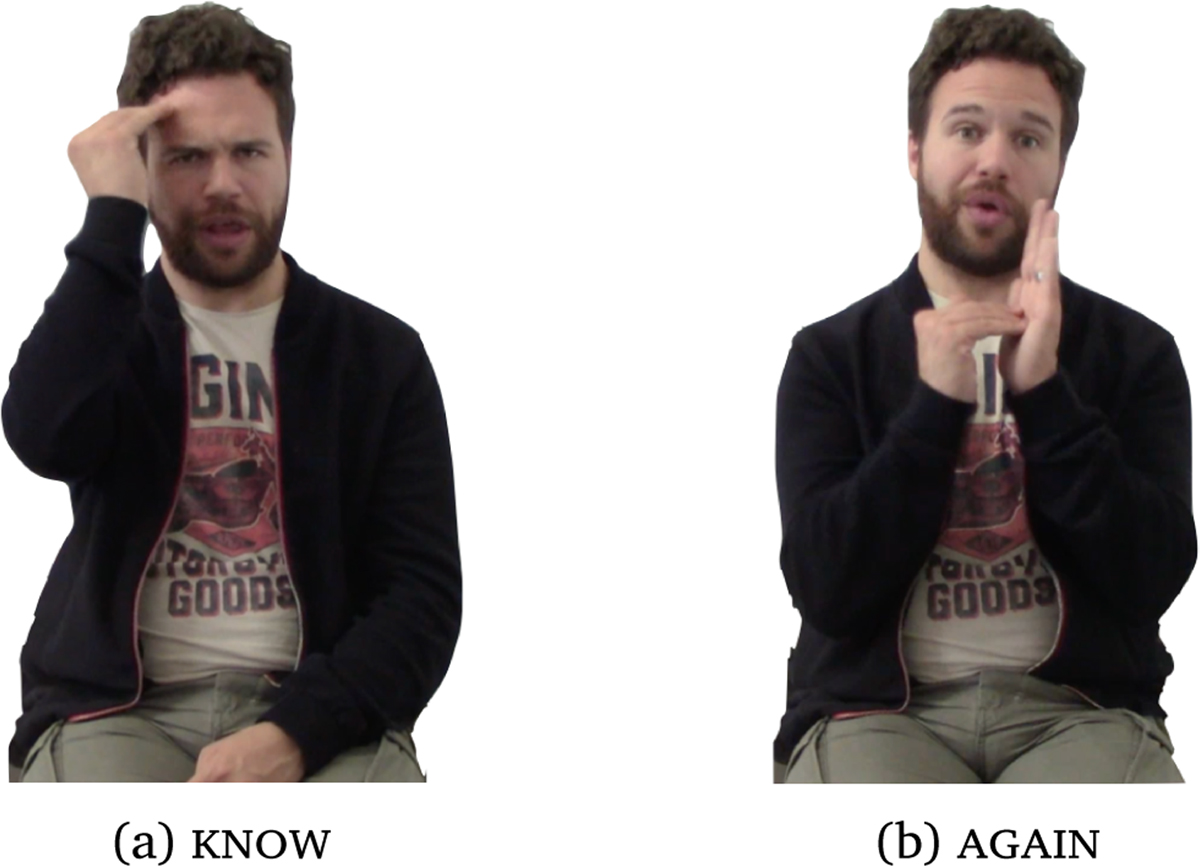
Location. A sign is produced either in the neutral space, i.e., the space in front of the signer, or on the signer’s body. In the phonological structure, if the sign is produced in the neutral space, only one node is selected between x, y, and z, depending on the plane (respectively the vertical, horizontal, or midsagittal plane). When it is produced on the body, the body itself is the plane. The x node is thus developed in many branches depending on the relevant major body part (head, torso, non-dominant arm, non-dominant hand), each dominating a set of features further specifying which subpart of the major location is selected. For example, the LSF signs know and again only differ on the location of the sign (head – forehead versus non-dominant hand – palm, respectively), as shown in Figure 4. While neutral space is coarsely identified by one plane/node only, locations on the signer’s body receive a finer-grained specification, automatically resulting in a higher level of complexity.
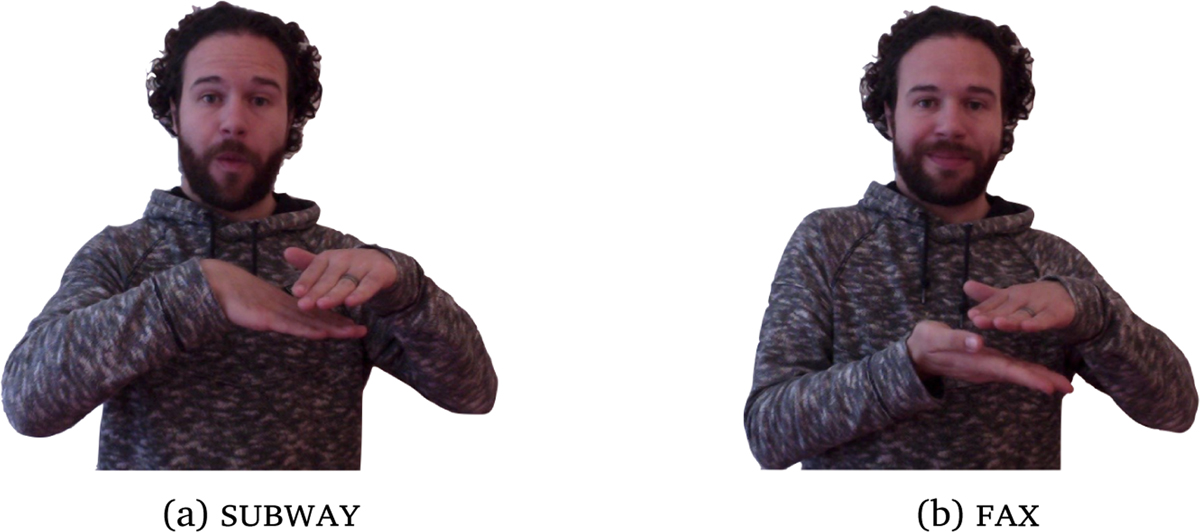
Orientation. Although contrastive, orientation is not treated as a primitive phonological class in the model. It is not represented by an independent (sub)branch in the Inherent Feature part of the structure. Rather, orientation is derived as a relation between a handpart feature and the plane of articulation (i.e., a feature referring to the hand part facing the location is specified in the Handshape branch of structure, and the developed Location branch of structure captures the location the specific handpart is facing). For example, in the LSF sign subway, the orientation is derived from the feature [back] of the dominant hand (Handshape branch of structure) facing the [palm] of the non-dominant hand (Location branch of structure), minimally contrasting with the orientation in the LSF sign fax, where it is the [palm] of the dominant hand facing the location, as illustrated in Figure 5.
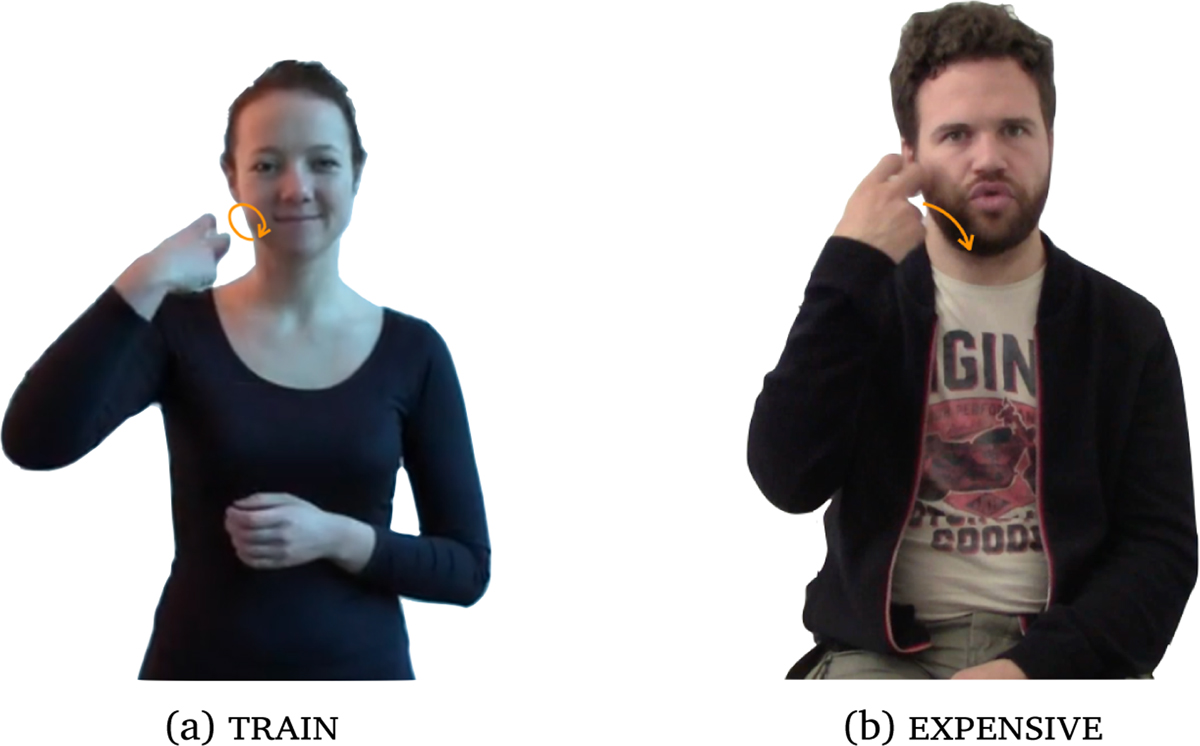
Movement. The movement component is captured by the Prosodic Feature branch of structure. This is done by identifying the proximal versus distal joints governing the articulation of the movement, resulting in location change, orientation change, or handshape change. Additional features describe the manner of path movements (circular, straight, or arc) and whether repetitions occur. Simultaneous movements are captured by specifying features at each relevant node, thus increasing the complexity of the representation. In the LSF minimal pair train ∼ expensive, the circular versus straight manner features contrastively distinguish the two signs as illustrated in Figure 6.
5. An error-driven measure for defining complexity
The error-driven measure of complexity we developed is based on the error rates of a repetition task which was conducted as part of a larger project, SIGN-HUB, aiming among other things at creating a battery of assessment tests for a variety of sign languages including LSF. Specifically, the signs included in the study reported here have been selected to be part of a lexical test to be administered to signers (picture-naming task),4 while the repetition task discussed below was administered to non-signers in order to obtain an estimate of the articulatory complexity of the items to be included in the lexical test. A description of the lexical test can be found in Donati, Annucci, and Jendhoubi (2020). All the analyses for this study have been conducted using the software R (Team, 2018). For sake of clarity, the details of each statistical model are reported in Appendix C.
5.1. Material and methods
The materials for the repetition study come from a pool of 108 LSF signs originally chosen for the purpose of the SIGN-HUB assessment test. They were selected on the basis of lack of transparency with the help of a native Deaf consultant.5
Since a referent is more frequently retrieved when signed than when spoken due to its more direct link with the visual modality (Klima & Bellugi, 1979; Perniss, Thompson, & Vigliocco, 2010), signs were chosen for being ‘non-transparent,’ i.e., their level of iconicity was low enough to prevent non-signers from guessing their meaning without additional information (Bellugi & Klima, 1976). To validate the non-transparent status of the signs, we asked 20 hearing non-signers to guess the meaning of each sign. Note that these participants were not those who took part in the sign-repetition task. We excluded all signs whose meaning was correctly guessed by two or more participants. We also excluded signs produced by our consultant without movement, because this would make the assessment of this parameter impossible. Compounds (Santoro, 2018) and signs whose phonological structure is ambiguous have also been excluded. All in all, fourteen signs were eliminated from the set: party (gesture referring to partying in the French culture), moon (no movement), belt, factory, family, lion-2, subway, star-2, sailing-boat (ambiguous in their phonological structure), and euro, mouse, sleepers, stamp, turtle (compounds); thus leaving a total of 94 signs as stimuli for the repetition task.
We video-recorded our Deaf consultant signing each stimulus in isolation in front of a blue screen. A complete list of the signs is provided in Appendix A.
Participants. Twenty hearing French adult non-signers acquainted with the visual culture of France were recruited (13 females, 7 males; age ranging from 21 to 72, mean = 40.26 years old). Participants were volunteers with no prior exposure to any sign language. Those with corrected vision were asked to keep their glasses/lenses.6
Procedure. The experiment took place either in the Laboratoire de Linguistique Formelle – Université de Paris/Paris Diderot (10 participants) or at the participants’ house (10 participants). Participants were sitting (except for two of them, who stood up for personal convenience) in front of a screen placed on a table at arm distance (∼1 to 1.5 meter from them). They were not aware of the purposes of the study. Each of them received the instructions of the task in French: He/she was asked to watch the video of a sign and to repeat it. They could watch the video of each sign only once and had to use the mouse and click to see the next sign. Their performance was video-recorded (2160 tokens). Though the sign stimuli were not randomized, no order effects were observed in the analyses (Appendix C.1).
Data coding. Two interns with a basic competence in LSF coded each participant’s repetition. As in Ortega and Morgan (2015), we coded for the four phonological categories, (i) handshape, (ii) location, orientation, and (iv) movement. To these we added a fifth criterion, (v) sign fluidity, i.e., whether the repetition was done without hesitation. This last criterion allowed us to distinguish between a completely correct repetition produced with hesitation from a correct production without hesitation. As a matter of fact, the absence of error in a repetition task does not always account for ease of production. Lexical processing is still in progress during an hesitation, hence reflecting an additional complexity level to that of accuracy in the phonological component of a sign.
For all tokens, a binary value was assigned to each of these five criteria: the value “1” indicated a correct repetition, the value “0” an incorrect one. Therefore, for each sign, the overall accuracy was obtained by summing all the values of the five parameters. The values provided by the coders were assigned based on the following protocol, adapted from Ortega and Morgan (2015):
Handshape: Handshapes can be described in terms of the number of selected fingers and their configuration (see Figure 6 for an example: The index and middle fingers are spread and flexed at the non-base joint). The repeated handshape had to correspond to the stimulus; otherwise it was considered as incorrect.
Location: In the neutral space, only the main plane was taken into account (i.e., no distinctions were made between the different 3D planes in space); the distinction between ipsi and contra was not. For body-anchored signs, the body was divided into six major regions (upper head/face, lower head/face, chest, neck/shoulder, arm, hand), and our coding was flexible as for more subtle divisions into subregions (Liddell & Johnson, 1989): When the repeated sign was produced in a region overlapping between two subregions (e.g., wrist for hand and arm; or jaw for lower head and neck), the production was coded as correct for both regions.
Orientation: The orientation of the hands is the phonological class the least described in the literature. As opposed to Ortega and Morgan (2015), we did not specify any angle but rather considered as correct when both the hand part and the plane it was facing could be correctly identified.
Movement: In movement, the number of repetitions and the amplitude of movement were not taken into account in the evaluation. However, if a movement was considered as ‘almost’ correct, it was coded as incorrect.
Sign fluidity: When the sign was not repeated fluently, i.e., when the participant hesitated, looked at his/her hands, or produced a halting sign, the repetition was considered as non fluid.
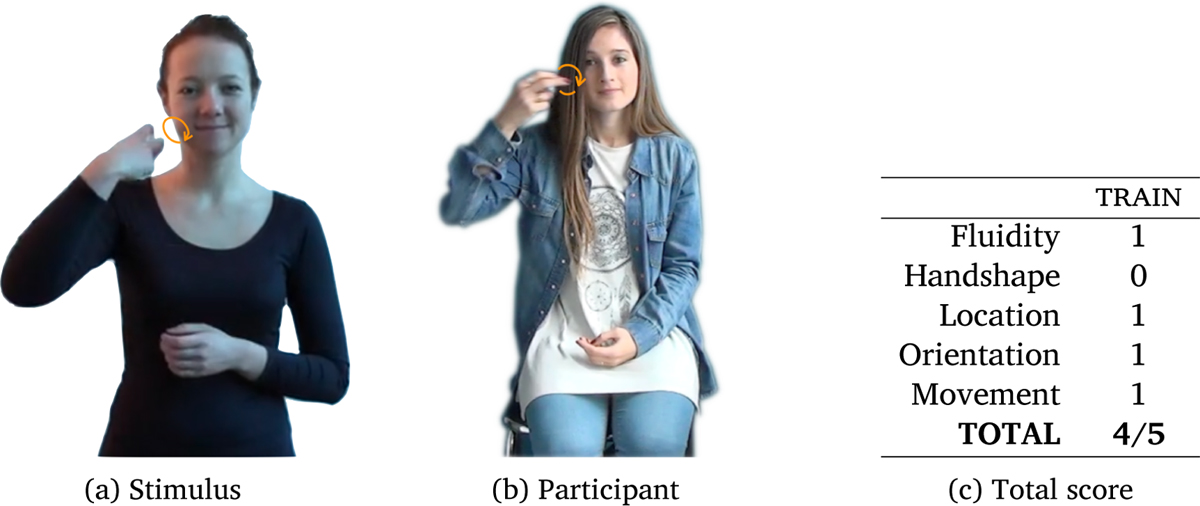
The degree of accuracy was directly mapped onto a complexity scale, ranging from 0 to 5, with 0 being the least accurate (hence the most complex), and 5 the most accurate (hence the least complex). An example is given in Figure 7, where the model and the participant differ in the extension of the selected fingers.
Evaluation of the repetition of train produced by a non-signer. The participant’s production (Figure 7b) is fluid and accurate for location, orientation, and movement, while the handshape is not with respect to the configuration prompted by the visual stimulus (Figure 7a) since the participant’s fingers are extended instead of flexed and spread. The total score for this particular production is thus 4/5 (Figure 7c).
Two coders (coders 3 and 4) with basic knowledge of LSF coded the entire data set (20 participants). In order to check reliability, two other coders (coders 1 and 2), also with basic knowledge of LSF, independently coded 25% of the data set (5 participants each), following the same instructions. A Gwet’s AC1 agreement coefficient (Gwet, 2008), a measure of inter-rater reliability, was calculated across the four annotators. We report separate values of agreement for each phonological class and each combination of coders in Table 1.7
Agreement coefficient estimate-AC1 (Gwet, 2008) and percentage of agreement for each phonological class between coders.
| Handshape | Location | Orientation | Movement | |
|---|---|---|---|---|
| Coders 1 & 3 (Part. 19–20) | 0.76 (86%) | 0.96 (95%) | 0.97 (96%) | 0.80 (85%) |
| Coders 1 & 4 (Part. 16-17-18) | 0.82 (89%) | 0.93 (93%) | 0.95 (96%) | 0.72 (81%) |
| Coders 2 & 3 (Part. 3-5-14) | 0.82 (88%) | 0.96 (95%) | 0.91 (93%) | 0.74 (82%) |
| Coders 2 & 4 (Part. 11–12) | 0.78 (85%) | 0.98 (97%) | 0.97 (98%) | 0.82 (86%) |
5.2. Results
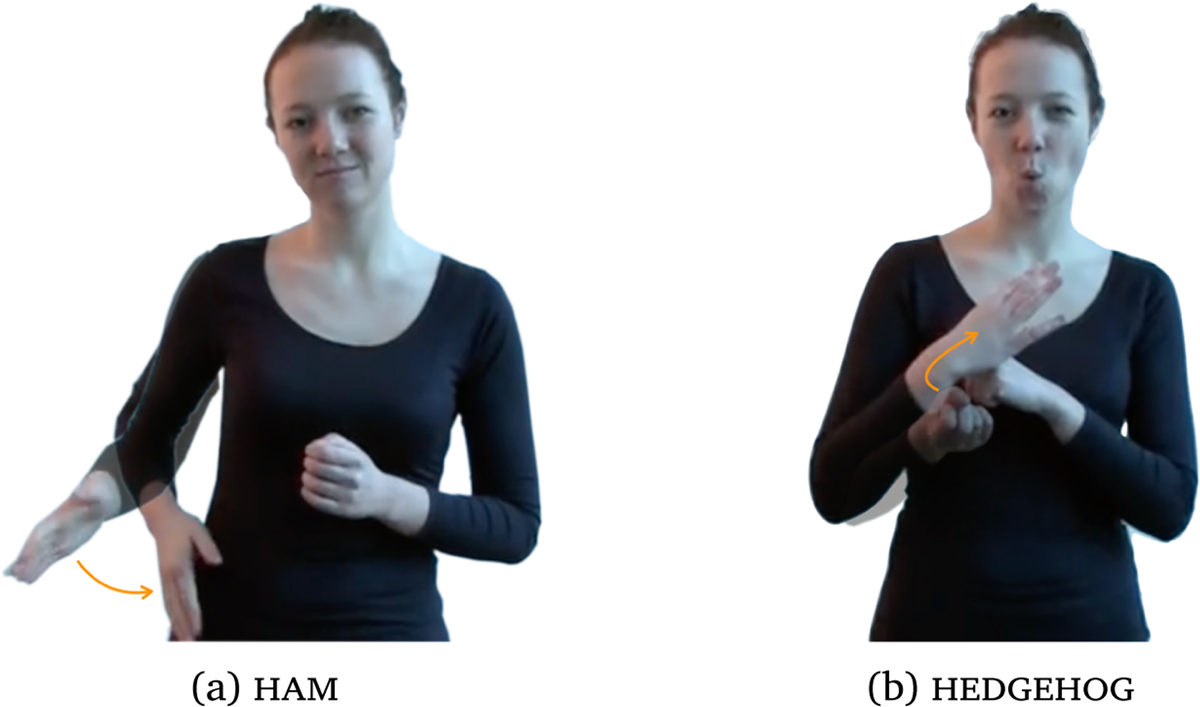
The overall error-driven complexity mean was 4.304 (SD = 0.43). The most accurately repeated sign was ham with an average score of 5 (Figure 8a), and the least accurate sign (i.e., most complex) was hedgehog with an average score of 3.15 (Figure 8b). Results for each item are reported in Appendix B.
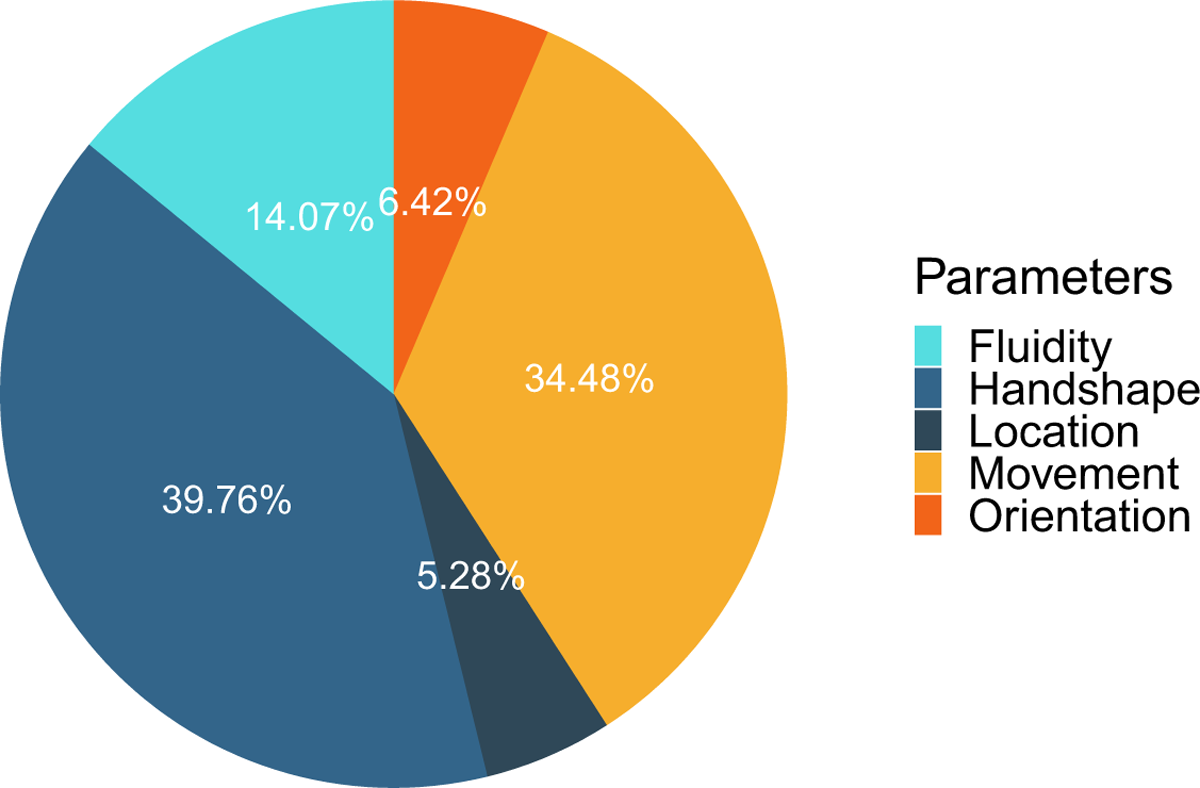
From the distribution of errors across the four phonological classes (Figure 9), handshape emerged as the phonological class with the highest percentage of errors (40%), followed by movement (35%), sign fluidity (14%), orientation (6%), and location (5%).
As documented in a series of studies on various linguistic and non-linguistic topics (see Baayen, 2008, and references therein), and given the large age range of the participants (21–75, mean = 40 years old), we considered chronological age as a potential factor affecting accuracy. Specifically, we expect that accuracy declines with chronological age, i.e., younger participants being more accurate than older ones, as reported in other repetition studies (D. P. Corina et al., 2020). We performed a cumulative link mixed model (ordinal package, Christensen, 2019) using the overall complexity of the error-driven measure as dependent variable and the participants’ age as predictor, with Participant and Item as random factors, and we found that accuracy decreased as age increased (p < .05, see Appendix C.2 for details).
6. A model-driven measure of complexity
The Prosodic Model (Brentari, 1998) offers a concrete opportunity to evaluate how closely theoretical models of sign language phonology reflect actual articulatory effort in production, for the following reasons. First, it provides a detailed description of the articulatory properties of signs grounded on both articulatory and perceptual phonetic properties. Second, the specific way in which the groups of features are organized is based on their phonological properties (contrastiveness and sensitivity to phonological processes). Third, it offers an explicit rationale to measure complexity in terms of number of branching nodes. Furthermore, it subsumes most of the properties of other phonological models (see Chapter 1 of Brentari, 1998, for a detailed description of such properties as we have discussed in Sections 3 and 4 above.).
6.1. Material and methods
In order to conduct a direct comparison with the error-driven measure of complexity, we generated the Prosodic Model representation of each of the 94 signs considered in Section 5 and then we computed their level of complexity by summing the number of nodes and positively specified features. We adopted the pool of features and branching nodes as described in Brentari (1998). This model was originally tailored for ASL phonology, although it easily extends to other sign languages. However, some features that are contrastive in ASL may not be contrastive in LSF and, vice versa, there could be other features that were not included in the original model because not contrastive in ASL which might be in LSF. The first point is not of particular concern as we are interested in the phonetic description and not in the phonological values of the features considered as we will compare this measure of complexity with error rates of non-signers, namely with the productions of individuals who are not sensitive to LSF phonology. Luckily, the second point was not relevant for our study in the sense that the pool of features included in the Prosodic Model allowed an adequate description of the 94 LSF signs in our data set (i.e., we did not have to introduce any new feature into the model8).
Coding procedure. A sign language linguist acquainted with the Prosodic Model (the first author) annotated the 94 signs used as stimuli in the repetition task on the basis of the hierarchical phonological representation of the features given by model.
The model-driven measure of complexity was obtained by summing the nodes and the features contained in the tree structure of each sign. For example, the phonological representation of the sign train (cf. Figure 7) and its corresponding total and partial scores are given in Figure 10 (for sake of replicability, a step-by-step description of the coding is provided in Appendix E). The Inherent Features branch of the structure is developed into two main branches for handshape and location. In the handshape branch, the shape of the (dominant) hand is described: The non-selected fingers are closed while the selected fingers (here the index and middle fingers) are spread and flexed on the non-base joints. In the Location branch of structure, the x node is developed since the sign is produced on the body. The right branch indicates the major body part, here the ipsi side of the head, and the location is specified in the left branch, the cheek.9 Finally, the Prosodic Feature branch of structure represents the rotational movement of the wrist which corresponds to an orientation change.10
(a) Phonological representation of the sign train based on the Prosodic Model (Brentari, 1998), and (b) its theoretical complexity score.
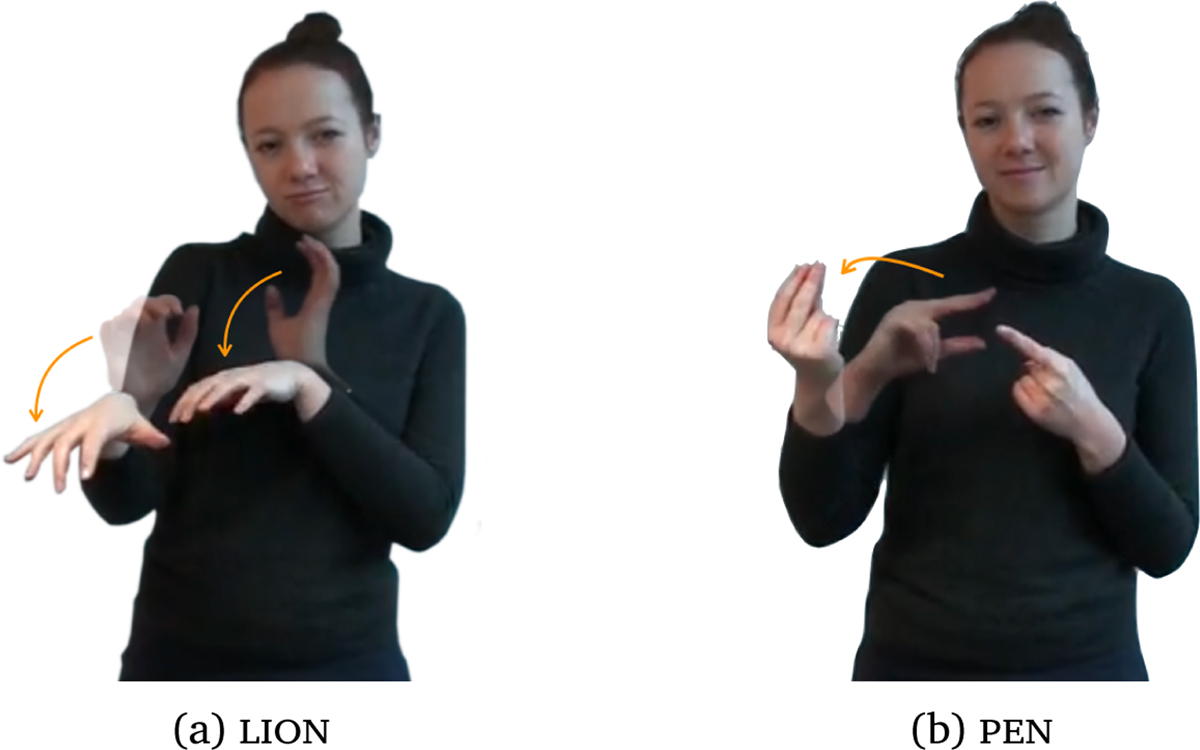
In the current study, we made two additional choices. First, we developed the branch of the non-dominant hand even though its repertoire is a restricted set of handshapes (e.g.,  handshapes in ASL).11 Our second choice concerns the annotation of handshape changes in the movement branch of structure. A handshape change is a set of two handshapes which correspond to the open and closed versions of one single handshape (Brentari, 1998). In the phonological representation of our stimuli, we developed the handshape that was not the predictable open or closed version of the pair. For example, the specified handshape in pen (see Figure 11b) is the initial handshape (here the [open] version) since the final one (i.e., the [closed] version) is predictable.
Illustration of signs with high and low complexity scores based on Brentari’s theoretical structure (1998): (a) The sign lion with the lowest score (15), and (b) the sign pen with the highest score (39).
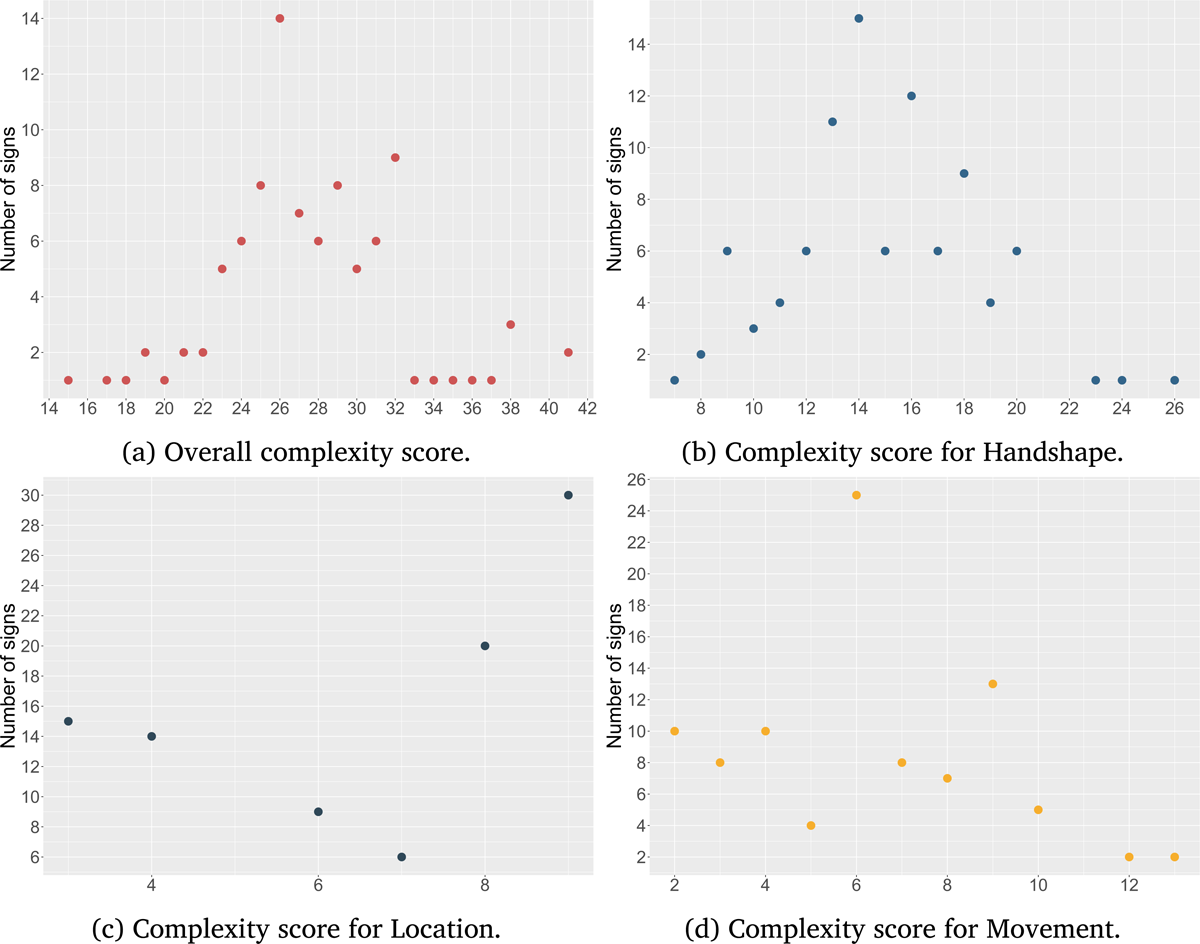
Partial and total scores of each sign are given in Figure 12 and a summary table is provided in Appendix B.
Distribution of complexity scores for (a) overall complexity, (b) handshape complexity, (c) location complexity, and (d) movement complexity from the annotation in the framework of the Prosodic Model (Brentari, 1998).
6.2. Results
Overall, we ended up with a set of 102 class nodes and terminal features: 46 for handshape (including 26 for the dominant hand), 29 for location, and 27 for movement. Of the total number of features available in the Prosodic Model, we used 90% of handshape features, 50% of location features, and 100% of movement features, indicating a considerable amount of variation in the quality of features in our sample.
Differently from the error-driven measure, where orientation and fluidity were part of the overall metric and received independent values, here the contribution of orientation is split between the handshape and the location branches because orientation is a derived phonological class in the Prosodic Model (see Section 3), while fluidity is irrelevant as the signs were all fluidly produced by our actor model.
The 94 annotated stimuli had an index of complexity ranging from 15 to 39. The least complex sign was lion with a total score of 15 (Figure 11a), while the most complex sign was pen with a total score of 39 (Figure 11b).
7. Predicting errors from the model: Towards a theory of sign complexity
To evaluate whether the model-driven measure (independent variable) significantly predicts the error-driven measure (dependent variable), we conducted a series of analyses (values for the independent variables are included in Table 2).
Summary table of the values included in the linear regressions. The first column reports the mean value from the repetition task and the second column reports the ranging scale, for overall complexity and for each category.
| Error rate: mean (SD) | Theoretical complexity (scale) | |
|---|---|---|
| Overall complexity | 4.30/5 (0.43) | 15–39 |
| Handshape | 0.72/1 (0.23) | 7–24 |
| Location | 0.96/1 (0.07) | 3–9 |
| Movement | 0.76/1 (0.23) | 2–13 |
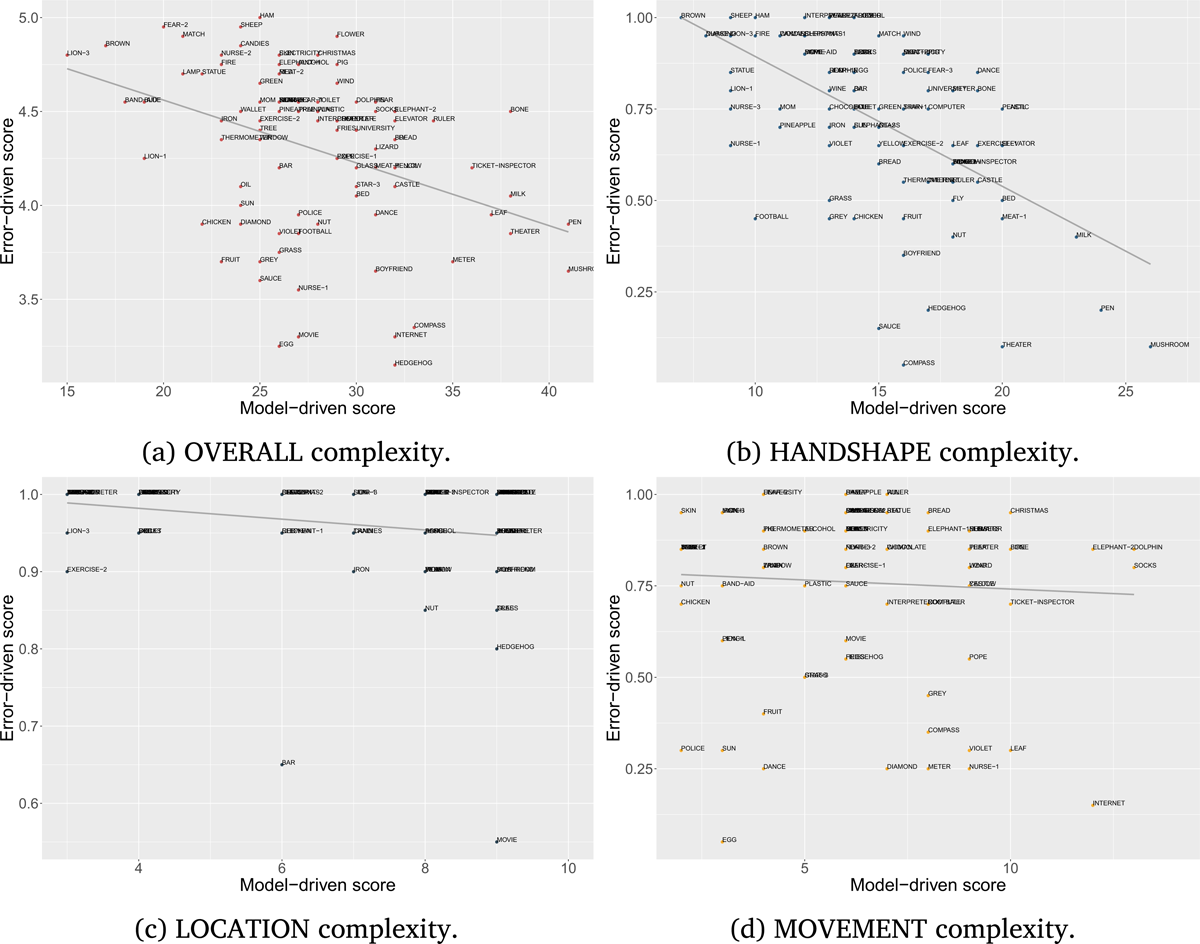
We hypothesized that the phonetic ground of the Prosodic Model and its complexity metrics could predict error rates in a sign repetition task performed by non-signers, hence establishing a strong relation between error-driven measures of complexity and model-driven metrics of complexity. In order to test this hypothesis we performed a cumulative link mixed model using the overall complexity of the error-driven measure as dependent variable and the overall model-driven measure of complexity as predictor, with Participant and Item as random factors. Results show a significant main effect of the model-driven factor (p < .001, see Appendix C.3). The plot in Figure 13a shows the relationship between the two metrics of complexity: The lower the accuracy score of the error-driven measure, the higher the overall complexity measure of the stimulus. The overall computation of the model-driven measure of complexity is able to predict overall accuracy/error rates in the repetition task.
In order to verify whether each subbranch of the Prosodic Model adequately captures the partial accuracy of Handshape, Location, and Movement of the error-driven measure of complexity, we computed three separate generalized mixed model linear regressions (Figures 13b, 13c, and 13d, respectively). Results show a significant effect for handshape (p < .001, see Appendix C.4) and for location (p < .05, see Appendix C.5), but not for movement (p > .05, see Appendix C.6). In other words, while the Prosodic Model correctly captures complexity of handshape and location it does not seem to be able to capture the complexity of the movement component.
Finally, we performed a cumulative link mixed model analysis to establish whether the complexity as predicted by each subcomponent of the Prosodic Model correlates with the error-driven complexity, and to what extent. We adopted a step-up procedure in which the dependent variable is the overall error-driven score, and the complexity of each model-driven phonological class is used as an independent predictor, with Participant and Item as random factors (Baayen, 2008; Baayen, Davidson, & Bates, 2008). Results show that handshape and location are significant main effects (p < .001 and p < .05, respectively) while movement is not (p > .05, see Appendix C.7).
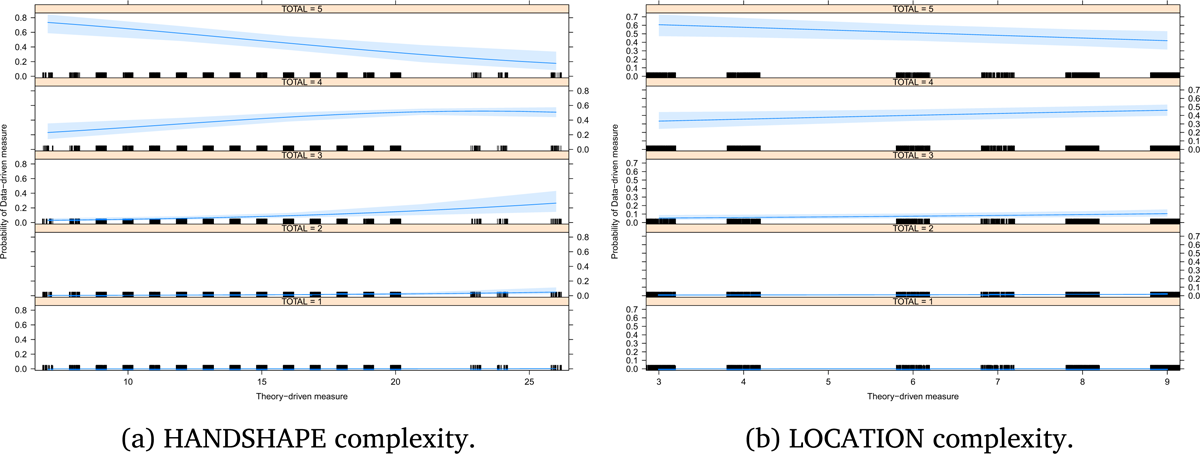
Specifically, the probability of having higher levels of accuracy decreases as complexity increases for either handshape or location, and the probability of lower levels of accuracy increases as complexity increases for either handshape and location (Figure 14).
These results confirm that while handshape and location as represented in the Prosodic Model adequately capture articulatory complexity, the movement component does not.
8. Discussion
Focusing on phonetic aspects, one way to measure complexity is by looking at accuracy in repetition tasks (Ortega & Morgan, 2015), but healthy adult signers may not be the ideal testers as they easily reach ceiling effect even with items coming from a sign language they do not know (Emmorey et al., 2009; Mann et al., 2010). Furthermore, their performance might be influenced by language specific phonological constraints (Aristodemo, 2013). An alternative is to use non-signers as a population that is not affected by any sign language phonology, and experimentally measure the level of accuracy in purely phonetic repetition tasks and thus identify the degree of complexity for specific signs on the basis of production errors. This is what has been done within the SIGN-HUB project as part of the validation procedure to select the items to be inserted in a lexical production task and this is the empirical source of the data considered in this study. While this procedure might seem as an inevitable step to develop standardized tests, it could be too expensive in terms of time and resources when it comes to create ad hoc psycho-linguistic tests where articulatory complexity is one among the many factors to be manipulated. Having another measure that strongly correlates with articulatory complexity and that can be used as a way to identify items with various degrees of complexity would be a viable alternative.
Current models of sign language phonology reach a sophisticated level of descriptive adequacy in two ways: by adopting a wide set of articulatory features and by organizing them in a hierarchical fashion. To what extent is this descriptive adequacy reflected in explanatory adequacy? There are two possible ways to address this question: One is to evaluate whether such models can account for phonological contrasts and for a reasonable range of phonological processes (e.g., deletion, epenthesis, assimilation, etc.). In other words, the evaluation concerns the phonological level more than the phonetic one. The other way to address their explanatory adequacy is to verify whether these models can be used to predict perceptual and articulatory complexity. This is what we did in this study. We used the richness of phonetic representations to predict the accuracy levels in a sign repetition task.12
In line with Ortega and Morgan (2015), the repetition task showed that handshape is the most difficult component to imitate, followed by movement, orientation, and location. Similar results are observed in sign language aphasic patients with location being reported as the most stable and less impacted phonological class as opposed to handshape which is subject to a larger number of substitutions and other error types (D. Corina, 2000). These results are also consistent with studies on sign processing and lexical access with handshape and movement being the phonological classes less readily retrieved contrary to location and orientation which are less affected (e.g., in a misperception task with Deaf signers, Orfanidou, Adam, Morgan, & McQueen, 2010). The same dichotomy has been observed in perception confusion studies with native Deaf signers, with contrasts in handshape and movement being the most difficult to discern in comparison with orientation and location (Tartter & Fischer, 1982). Even though location seems to be easier to repeat as opposed to the other phonological classes (e.g., Emmorey et al., 2009), a reviewer made us notice that the error rate for location in our study is surprisingly low. This could be explained by the very rough distinction that was made among the different body regions when coding the repetition task (cf. Section 5). The fact that signs produced on different body parts were not counted as incorrect when produced in the same large region might have led to an underestimation of the errors in location. Nonetheless, the model-driven metric of complexity used in this study is able to predict that signs that involve a higher number of place of articulation features and nodes are more prone to repetition errors than those requiring a lower number of features and nodes.
Accuracy rate also tends to correlate with chronological age, with older participants being less accurate than younger participants. Several factors can account for the observed decline, such as age-related effects on working memory and/or on neuromuscular, i.e., physiological, abilities. While sign languages require a motor system that affects working memory and hence the storage for signs (e.g., Emmorey, 2001, pp. 233–234), elderly individuals show a decrease of neuromuscular and motor skills with age (see Hunter, Pereira, & Keenan, 2016, for a review). At the present time it is impossible to identify more precisely the exact origin of the chronological age effect, and additional studies must be carried out in order to test the impact of cognitive or motor-related causes. Such results remain nevertheless important for our understanding and interpretation of articulatory abilities.
Two reviewers pointed out that the source of error in the error-driven measure may not be fully attributable to articulatory complexity as the repetition task itself involves a first step in which the sign/gesture is seen on a video. It is possible then that perceptual complexity is an alternative source of error in addition to articulatory complexity. This is highly plausible and our study cannot disentangle this issue. However, what is relevant here is that the model-based metric, which capitalizes on articulatory features, is able to predict error rate independently from the fact that the source of that error is perceptual, articulatory, or both. In fact, studies showed that there is a strict correlation between the two (e.g., Mann et al., 2010). Let us notice in passing that a perception version of this study, for example one in which participants are asked to rate the degree of complexity based on visual perception of handshape would not solve the problem either. This is what Aristodemo (2013) did, and she found a correlation between handshape complexity as computed with Brentari’s model and complexity as emerging from a rating task. However, despite the fact that the task was clearly perceptual, it is not possible to exclude that participants were trying to reproduce the handshape itself in order to assess its degree of complexity. A different experimental design is needed in order to separate the contribution of perception from that of articulation as potential source of error, something we leave for future works.
Statistical analyses successfully showed that theory-based models can be used as reliable measures to assess overall articulatory complexity. We also showed that among the major sub-lexical units of sign phonology/phonetics, handshape is the one where the correlation between the model-driven and the error-driven measure is stronger, followed by location, while no correlation is found with movement. The effect of handshape on sign complexity is in line with previous findings (Emmorey et al., 2009) and can be accounted for in similar terms. Overall, the hand configuration has a higher number of joints, hence in principle a higher degree of freedom than the other components of a sign. This is probably the source of the higher error rates in the repetition task. The higher the number of joints that require overt control, the higher the probability to commit an error when trying to repeat. Crucially, the high degree of freedom of handshape is also reflected in theoretical models in terms of a higher number of handshape nodes and features required to meet descriptive adequacy when compared to the other sublexical components of a sign (53 handshape features versus 16 for location and 28 for movement in the Prosodic Model). The high number of handshape features easily maps into a fine-grained complexity scale, which nicely matches the handshape error rate of our study and the perceived complexity in Aristodemo’s study (2013). Although to a minor extent, the articulatory features of the location subbranch are also able to predict location errors showing that even a complexity scale with a reduced number of nodes and features is able to capture some degrees of effort.13 What remains to explain, however, is why the feature geometry of the movement component does not capture the error rates of the repetition task, despite the fact that it contains a higher number of features than the location component. One possibility could be that the movement component of signs is somehow intrinsically different from handshape and location in a way that it is not captured by the feature geometry of the Prosodic Model. In line with categorical perception studies (e.g., Emmorey, McCullough, & Brentari, 2003), location and movement are perceived as more ‘gestural’ as opposed to handshape which is perceived as being more ‘phonological’ (Goldin-Meadow & Brentari, 2017); both location and movement are considered to be more continuous. While our results on location are in line with the latter statement, results on movement are not, and this might be due to the fact that movement, as a dynamic component of signs, cannot be directly compared to its static counterpart (i.e., handshape and location, as well as orientation).
Additionally, one aspect that is not taken into account in our study is the difference in movement types (path movements produced by a shoulder or elbow movement versus orientation and aperture change produced by movement on the wrist or fingers, respectively). In the Prosodic Model, the movement branch of structure is built on a sonority scale, with larger movements being more sonorant than smaller movements. In other terms, the larger the movement, the easier it is to perceive (Brentari, 1998, pp. 216–224). This is not reflected in the number of nodes and features, which means that we cannot account for the perceptual complexity of the different types of movement in the current state of our study.
An explanation along this line may find some support in the dual status of movement in sign phonology. In addition to playing a segmental role, thus capturing phonological contrasts, movement is also involved in higher-level functions. Specifically, its dynamic and temporal properties serve as prosodic units in the sign structure representing the syllable nucleus. This aspect is not encoded in the feature geometry of the Prosodic Features branch but it is included as an additional extension of the representation where the hierarchical structure is mapped into time slots. Currently there is no proposal on how to include this aspect as part of sign complexity. Of course, such a phonological explanation does not immediately extend to the phonetic nature of the mapping we are proposing in this study. Non-signers may be sensitive to their rhythmic correlates which could affect the perception and production of gestures. For example, while heavy syllables are represented with a similar number of features and nodes, they may surface with completely different trajectories and distribute over time in a different way. Similarly, repetitions of short and long movements may affect the sign repetition task in a way that is not captured by the Prosodic Model (or any other model as far as we know). If this is the case, then future work should better investigate how to measure the contribution of movement in the computation of sign complexity. For example, conducting a similar study while using the Dependency Model (van der Hulst & van der Kooij, 2021) might be interesting as the movement component is derived differently. A radically alternative explanation could be that the model-driven measure is sensitive to extreme values while it under-performs with intermediate values. In other words, the correlation with the error-driven measure could be stronger when very easy and very difficult items are considered. If we look at the distribution of the signs in our sample by the model-driven measure of complexity in Figure 12, we see that complexity increases more or less regularly for handshape and is probably slightly over-represented with location. Crucially, extreme values are under-represented in the movement plot, where most of the signs fall in the middle of the scale. It is possible, then, that the model-driven measure of complexity is not efficient for the movement branch because not enough items in our sample fall in the extreme values of the complexity scale. In order to verify this possibility we ran an analysis where we only considered the five most complex and the five less complex signs for movement as resulting from the model-driven measure we used in this paper (Appendix C.8). Results show that even when considering only extremes values, the model-driven measure for movement does not predict accuracy.
As familiarity ratings highly correlate with lexical frequency in corpus studies (Baayen, 2008), our study shows that a model-driven measure of complexity based on Brentari’s Prosodic Model (1998) correlates with an error-driven measure of complexity based on repetition tasks by non-signers. At a very concrete level, the measure of complexity that we are proposing is easy to compute and provides a quick but robust test to control for the phonetic complexity of lexical items in experimental studies. However, our study addresses the issue of explanatory adequacy at a deeper level, providing independent support for a specific theoretical model of sign phonology, namely the Prosodic Model. We can easily speculate that other models, similarly based on feature-geometry principles, may yield comparable results, as long as their phonetic representation is accurate.
Finally, this study is the first to address articulatory complexity in LSF signs, thus increasing not only our knowledge of this language in particular, but also articulatory complexity of sign languages in general. The correlation between error rates in the repetition task performed by non-signers and the measure of complexity based on sign language models that we found indicates that a feature approach to complexity can be in principle extended to gestures in general. In fact, what we actually measure in our study is phonetic complexity. However, this does not mean that sign language models do not capture the phonological component of signs, but rather that this phonological component is well grounded on phonetic basis. Determining which feature is contrastive, hence susceptible to be included in a phonological inventory of a language, which node or group of features is subject to specific phonological processes (e.g., epenthesis) is a matter of phonology and these aspects are captured by constraining these models in a language specific way.
9. Conclusions
Research on phonological complexity has led and still leads to a better understanding of human language and its functioning. At present, phonetic complexity and phonological structure are proven to be intimately related in spoken languages, a relation that has been only marginally explored in sign languages. This study highlights the role of each sublexical unit of signs in determining complexity. We elaborated a model-driven measure of complexity based on Brentari’s (1998) Prosodic Model and we mapped the scale of complexity on an error-driven scale of complexity based on error rates in a repetition task performed by hearing non-signers. This is the first study of its kind, where the comparison is done both at the global level and at the individual level of each sublexical unit of a sign. As it stands, it acts as a stepping stone for future work on articulatory effort and phonological complexity. While here we focused the analysis on naïve hearing non-signers, thus contributing to the quantification of pure articulatory complexity, a more comprehensive study of how a phonological system impacts sign complexity is also needed to understand, for instance, how the categorical perception of phonological contrasts, the size and quality of phonemic inventories may reduce or amplify pure phonetic complexity.
Sign language communities are fragile for several reasons: They are language minorities and thus suffer from a number of issues related to language rights and language justice. Besides, language transmission to infants is not granted as only a small portion of deaf children is born into signing families. Moreover, local sign languages are not often recognized the status of fully-fledged legitimate languages, and consequently language access is seldom guaranteed in schools. The particular situation that characterizes sign languages urgently requires screening devices that reliably measure proficiency in all linguistic domains, including lexical phonology, and in a manner that adequately reflects the peculiarity and variety of Deaf signing populations, where natives are a minority, and go together with early and late learners. Within this frame, it is crucial that the items of both generalized screening tools and ad hoc tests are adequately controlled for a variety of factors like frequency, familiarity, transparency (Caselli & Pyers, 2017), and degree of complexity. Our study offers a quick and robust way to measure complexity and can be used as a basis to create experimental stimuli to assess this aspect of sign competence.
Additional Files
The additional files for this article can be found as follows:
List of the items tested in our experiment in French sign language. DOI: https://doi.org/10.5334/labphon.6439.s1
Tested items and their partial and total scores from both model- and error-driven measures. DOI: https://doi.org/10.5334/labphon.6439.s2
Models computed and resulting parameters. DOI: https://doi.org/10.5334/labphon.6439.s3
Fully-expanded structure of the Prosodic Model (Brentari, 1998) with every possible nodes and features root. DOI: https://doi.org/10.5334/labphon.6439.s4
Detailed description of the model-driven measure for the sign train (Figure 10): Step-by-step procedure. DOI: https://doi.org/10.5334/labphon.6439.s5
Complexity scores for each sign from the annotation in the framework of the Prosodic Model (Brentari, 1998). DOI: https://doi.org/10.5334/labphon.6469.s6
Notes
- In Ortega and Morgan (2015) the authors use the term ‘component’ to refer to phonological classes (i.e., handshape, orientation, location, and movement), as well as subnodes such as the H2 node in two-handed signs. We chose to report the same term to be in line with the authors’ terminology. [^]
- Native signers are congenitally deaf individuals born into deaf signing families. We use 'Deaf' to refer to people who use sign language as their primary mean of communication and that, culturally, belong to the community that shares that language. [^]
- The aim of the current study is not to say how one particular model better predicts complexity as opposed to others, but rather to evaluate its capacity to do so. [^]
- The relevant SIGN-HUB task is called PICTURE NAMING TASK IN LSF (LEXNAMLSF). For more information about the SIGN-HUB project: https://www.sign-hub.eu/. [^]
- In this particular study, frequency and regional variation are not relevant since the participants do not have access to the language. [^]
- We assume that the fact that hearing people are also gesturers is not affecting the study (Goldin-Meadow & Brentari, 2017). [^]
- A Kappa Coefficient of Agreement (Cohen, 1960), a common measure of inter-rater reliability, was calculated across the four annotators. The resulting inter-rater reliability scores are indeed low, but this is explained by the low rate of errors made by the participants, i.e., one disagreement between the coders automatically appears to have a strong impact on the Kappa score. For this reason, we calculated the Gwet’s AC1 agreement coefficient (Gwet, 2008) as it was shown to be more stable than Cohen’s Kappa (e.g., see Wongpakaran, Wongpakaran, Wedding, & Gwet, 2013). [^]
- Of course this does not mean that the same set of features that describes ASL phonology adequately describes the LSF phonology. [^]
- Notice that in order to independently compute the number of nodes necessary to capture both handshape and location, the Inherent Feature node was counted twice. While this increases by one point the overall complexity of a sign, it does so uniformly across all signs. Since we did not compare the complexity of the Inherent and Prosodic branches this move does not affect any of the statistical analyses conducted in the study. [^]
- Any movement is represented in the Prosodic Feature branch of structure, whether it is an aperture change, an orientation change, or a location change (i.e., path movement or change in the 3D plane). [^]
- Despite their simple phonological structure, the number of positively specified features is not identical across these handshapes. Our choice allow us to obtain fine-grained distinction among this type of signs, something that is not possible if we were following Battison’s (1978) typology, for instance. [^]
- Since our data collection involves non-signing participants only, one may wonder whether our findings relate to the phonetics of signs as opposed to their phonology and whether the more gradient nature of non-signers in related tasks might affect our interpretation (Kita, van Gijn, & van der Hulst, 2014). We thank Shengyun Gu and Harry van der Hulst for pointing out these aspects. It is true that our study only targets phonetic aspects of sign representation. In fact, what we are offering is a way to compute pure phonetic complexity. As far as the more gradient behavior of non-signers as opposed to signers, a much more similar study to the one described here, namely Aristodemo (2013), showed that both signers and non-signers are gradient in their judgments about complexity. Notice further that the granularity found in our study does not depend on the behavior of the participants, but on the scale we used to compute complexity. [^]
- As the Prosodic Model derives orientation from a relationship between handshape and location, we cannot measure its impact as an independent factor. Here we merged orientation with sign fluidity, and both can only be included in the overall complexity value in the sign repetition task. [^]
Acknowledgements
We are very grateful to Yair Haendler for his useful feedback on our statistical analyses. We warmly thank our deaf consultants, Laurène Loctin for her help during the elaboration of the stimuli (as part of the SIGN-HUB project), and Thomas Lévêque for all his work and his great help, as well as all the participants without whom this study would not have been possible. Special thanks go to Ingrid Konrad who authorized the publication of her pictures. The coding of the repetition task was performed by three student assistants, whom we warmly thank: Angélique Jaber, Catherine Suzanne, and Clémence Vallette. Finally, various parts of the study have been presented at conferences (PaPE 2019, GLOW42 workshop, TISLR 2019) and we want to thank all the audiences for their comments and interesting discussions.
The research leading to these results received funding from the European Research Council under the European Union’s Seventh Framework Program (FP/2007–2013): ERC H2020 Grant Agreement No. 788077–Orisem (PI: Schlenker). Part of the research was conducted at Institut d’Etudes Cognitives (ENS), which is supported by grants ANR-10-IDEX-0001-02 PSL*, ANR-10-LABX-0087 IEC, and ANR-17-EURE-0017 FrontCog. Some of the research summarized in this paper is part of the SIGN-HUB project, which has received funding from the European Union’s Horizon 2020 research and innovation program under the grant agreement No 693349. This work was also partly supported by the program “Investissements d’Avenir” ANR-10-LABX-0083 (Labex EFL).
Competing Interests
The authors have no competing interests to declare.
Author Contributions
Justine Mertz is the first author and was responsible for the model-driven part of the study and the appendices. Caterina Donati and Carlo Geraci are the principal investigators who co-supervised the study. Data collection for the error-driven part was conducted by Chiara Annucci as part of the SIGN-HUB project, Doriane Gras, Beatrice Giustolisi, and Justine Mertz worked closely together on the statistical analyses, and all authors contributed in the discussion.
References
Anderson, J. M., & Ewen, C. J. (1987). Principles of Dependency Phonology. Cambridge: Cambridge University Press. DOI: http://doi.org/10.1017/CBO9780511753442
Ann, J. (1996). On the relation between ease of articulation and frequency of occurrence of handshapes in two sign languages. Lingua, 98(1–3), 19–41. DOI: http://doi.org/10.1016/0024-3841(95)00031-3
Ann, J. (2006). Frequency of occurrence and ease of articulation of sign language handshapes: The Taiwanese example. Gallaudet University Press.
Aristodemo, V. (2013). The complexity of handshapes: Perceptual and theoretical perspective. Università Ca’ Foscari Master’s Thesis.
Baayen, R. H. (2008). Analyzing Linguistic Data: A Practical Introduction to Statistics using R. Cambridge: Cambridge University Press. DOI: http://doi.org/10.1017/CBO9780511801686
Baayen, R. H., Davidson, D. J., & Bates, D. M. (2008). Mixed-effects modeling with crossed random effects for subjects and items. Journal of memory and language, 59(4), 390–412. DOI: http://doi.org/10.1016/j.jml.2007.12.005
Battison, R. (1978). Lexical borrowing in American sign language. (Silver Spring ed.). MD: Linstok Press.
Bellugi, U., & Klima, E. S. (1976). Two faces of sign: Iconic and abstract. Annals of the New York Academy of Sciences, 280, 514–538. DOI: http://doi.org/10.1111/j.1749-6632.1976.tb25514.x
Bochner, J. H., Christie, K., Hauser, P. C., & Searls, J. M. (2011). When is a difference really different? Learners’ discrimination of linguistic contrasts in American Sign Language. Language Learning, 61(4), 1302–1327. DOI: http://doi.org/10.1111/j.1467-9922.2011.00671.x
Brentari, D. (1998). A Prosodic Model of Sign Language Phonology. Cambridge: MIT Press. DOI: http://doi.org/10.7551/mitpress/5644.001.0001
Brentari, D. (2019). Sign Language Phonology. Cambridge: Cambridge University Press. DOI: http://doi.org/10.1017/9781316286401
Caselli, N. K., & Pyers, J. E. (2017). The road to language learning is not entirely iconic: Iconicity, neighborhood density, and frequency facilitate acquisition of sign language. Psychological science, 28(7), 979–987. DOI: http://doi.org/10.1177/0956797617700498
Chitoran, I., & Cohn, A. (2009). Complexity in phonetics and phonology: gradience, categoriality, and naturalness. In Approaches to phonological complexity (De Gruyter Mouton ed., Vol. 16, pp. 19–46). Berlin. DOI: http://doi.org/10.1515/9783110223958.19
Chomsky, N., & Halle, M. (1968). The sound pattern of English (Harper & Row New York ed.). New York: Harper and Row.
Christensen, R. H. B. (2019). ordinal: Regression Models for Ordinal Data. Retrieved from https://cran.r-project.org/package=ordinal (R package version 2019.3-9).
Clements, G. N. (1985). The Geometry of Phonological Features. Phonology Yearbook, 2(1), 225–252. DOI: http://doi.org/10.1017/S0952675700000440
Cohen, J. (1960). A coefficient of agreement for nominal scales. Educational and Psychological Measurement, 20(1), 37–46. DOI: http://doi.org/10.1177/001316446002000104
Conlin, K. E., Mirus, G. R., Mauk, C., & Meier, R. P. (2000). The acquisition of first signs: Place, handshape, and movement. In Language acquisition by eye. (C. Chamberlain, J. P. Morford, & R. I. Mayberry ed., pp. 51–69). Mahwah, NJ: Erlbaum. DOI: http://doi.org/10.4324/9781410601766-16
Corina, D. (2000). Some observations regarding paraphasia in American Sign Language. In The signs of language revisited: An anthology to honor Ursula Bellugi and Edward Klima (Psychology Press ed., pp. 493–507).
Corina, D. P., Farnady, L., LaMarr, T., Pedersen, S., Lawyer, L., Winsler, K., …, & Bellugi, U. (2020). Effects of age on American Sign Language sentence repetition. Psychology and Aging, 4(35), 529–535. DOI: http://doi.org/10.1037/pag0000461
Donati, C., Annucci, C., & Jendhoubi, V. (2020, June). Assessing lexical competence in European sign languages. Poster presented at FEAST 2020.
Donegan, P. J., & Stampe, D. (1979). The study of natural phonology. In Current approaches to phonological theory (Vol. 126173). Bloomington: Indiana University Press.
Dresher, E., & van der Hulst, H. (1993). Head-dependent asymmetries in phonology. Toronto Working Papers in Linguistics, 12(2).
Easterday, S. (2019). Highly complex syllable structure: A typological and diachronic study. Language Science Press. DOI: http://doi.org/10.5281/zenodo.3268721
Emmorey, K. (2001). Language, cognition, and the brain: Insights from sign language research (1st ed.). Psychology Press. DOI: http://doi.org/10.4324/9781410603982
Emmorey, K., Bosworth, R., & Kraljic, T. (2009). Visual feedback and self-monitoring of sign language. Journal of Memory and Language, 61(3), 398–411. DOI: http://doi.org/10.1016/j.jml.2009.06.001
Emmorey, K., McCullough, S., & Brentari, D. (2003, February). Categorical perception in American Sign Language. Language and Cognitive Processes, 18(1), 21–45. DOI: http://doi.org/10.1080/01690960143000416
Gierut, J. A. (2007). Phonological Complexity and Language Learnability. American Journal of Speech-Language Pathology, 16(1), 6–17. Retrieved 2021-07-30. DOI: http://doi.org/10.1044/1058-0360(2007/003)
Goldin-Meadow, S., & Brentari, D. (2017). Gesture, sign, and language: The coming of age of sign language and gesture studies. Behavioral and Brain Sciences, 40, E46. DOI: http://doi.org/10.1017/S0140525X15001247
Goldrick, M., & Daland, R. (2009). Linking speech errors and phonological grammars: Insights from Harmonic Grammar networks. Phonology, 26(1), 147–185. DOI: http://doi.org/10.1017/S0952675709001742
Gwet, K. L. (2008). Computing inter-rater reliability and its variance in the presence of high agreement. British Journal of Mathematical and Statistical Psychology, 61(1), 29–48. DOI: http://doi.org/10.1348/000711006X126600
Hohenberger, A., Happ, D., & Leuninger, H. (2002). Modality-dependent aspects of sign language production: Evidence from slips of the hands and their repairs in German Sign Language. In Modality and structure in signed and spoken languages (pp. 112–142). Cambridge: Cambridge University Press. DOI: http://doi.org/10.1017/CBO9780511486777.006
Hunter, S. K., Pereira, H. M., & Keenan, K. G. (2016, October). The aging neuromuscular system and motor performance. Journal of Applied Physiology, 121(4), 982–995. DOI: http://doi.org/10.1152/japplphysiol.00475.2016
Kirchner, R. M. (2001). An effort based approach to consonant lenition. Psychology Press.
Kita, S., van Gijn, I., & van der Hulst, H. (2014). The non-linguistic status of the Symmetry Condition in signed languages: Evidence from a comparison of signs and speech-accompanying representational gestures. Sign Language & Linguistics, 17(2), 215–238. DOI: http://doi.org/10.1075/sll.17.2.04kit
Klima, E. S., & Bellugi, U. (1979). The signs of language. Harvard University Press.
Lehmann, C. (1974). Isomorphismus im sprachlichen Zeichen. In Arbeiten des Kölner Universalienprojekts 1973/74 (Linguistic Work-shop) (Vol. 2, pp. 98–123). München: W. Fink.
Liddell, S. K., & Johnson, R. E. (1989). American sign language: The phonological base. Sign language studies, 64(1), 195–277. DOI: http://doi.org/10.1353/sls.1989.0027
Maddieson, I. (2005a). Correlating phonological complexity: data and validation. UC Berkeley PhonLab Annual Report, 1(1). DOI: http://doi.org/10.5070/P795M171V6
Maddieson, I. (2005b). Issues of phonological complexity: Statistical analysis of the relationship between syllable structures, segment inventories and tone contrasts. UC Berkeley PhonLab Annual Report, 1(1). DOI: http://doi.org/10.5070/P73CM3W6CK
Maddieson, I. (2009). Calculating phonological complexity. In Approaches to phonological complexity (pp. 85–110). Berlin: Mouton de Gruyter. DOI: http://doi.org/10.1515/9783110223958.83
Maddieson, I., Bhattacharya, T., Smith, D. E., & Croft, W. (2011). Geographical distribution of phonological complexity. Linguistic Typology, 15(2), 267–279. DOI: http://doi.org/10.1515/lity.2011.020
Mann, W., Marshall, C. R., Mason, K., & Morgan, G. (2010, January). The Acquisition of Sign Language: The Impact of Phonetic Complexity on Phonology. Language Learning and Development, 6(1), 60–86. DOI: http://doi.org/10.1080/15475440903245951
Marshall, C., Mann, W., & Morgan, G. (2011). Short-term memory in signed languages: Not just a disadvantage for serial recall. Frontiers in Psychology, 2, 102. DOI: http://doi.org/10.3389/fpsyg.2011.00102
Marsico, E., Maddieson, I., Coupé, C., & Pellegrino, F. (2004). Investigating the “hidden” structure of phonological systems. In Annual Meeting of the Berkeley Linguistics Society (Vol. 30, pp. 256–267). (Issue: 1). DOI: http://doi.org/10.3765/bls.v30i1.3427
Meyer, A. S. (1992). Investigation of phonological encoding through speech error analyses: Achievements, limitations, and alternatives. Cognition, 42(1–3), 181–211. DOI: http://doi.org/10.1016/0010-0277(92)90043-H
Mirus, G., Rathmann, C., & Meier, R. P. (2001). Proximalization and distalization of sign movement in adult learners. In Signed languages: Discoveries from international research (pp. 103–119).
Orfanidou, E., Adam, R., McQueen, J. M., & Morgan, G. (2009). Making sense of nonsense in British Sign Language (BSL): The contribution of different phonological parameters to sign recognition. Memory & Cognition, 37, 302–315. DOI: http://doi.org/10.3758/MC.37.3.302
Orfanidou, E., Adam, R., Morgan, G., & McQueen, J. M. (2010). Recognition of signed and spoken language: Different sensory inputs, the same segmentation procedure. Journal of Memory and Language, 62(3), 272–283. DOI: http://doi.org/10.1016/j.jml.2009.12.001
Ortega, G., & Morgan, G. (2015). Phonological development in hearing learners of a sign language: The influence of phonological parameters, sign complexity, and iconicity. Language Learning, 65(3), 660–688. DOI: http://doi.org/10.1111/lang.12123
Perniss, P., Thompson, R., & Vigliocco, G. (2010). Iconicity as a general property of language: Evidence from spoken and signed languages. Frontiers in Psychology, 1, 227. DOI: http://doi.org/10.3389/fpsyg.2010.00227
Romani, C., Galuzzi, C., Guariglia, C., & Goslin, J. (2017, November). Comparing phoneme frequency, age of acquisition, and loss in aphasia: Implications for phonological universals. Cognitive Neuropsychology, 34(7–8), 449–471. DOI: http://doi.org/10.1080/02643294.2017.1369942
Rosen, R. S. (2004). Beginning L2 production errors in ASL lexical phonology: A cognitive phonology model. Sign Language & Linguistics, 7(1), 31–61. DOI: http://doi.org/10.1075/sll.7.1.04beg
Sagey, E. C. (1986). The representation of features and relations in non-linear phonology (PhD Thesis). Massachusetts Institute of Technology.
Sandler, W. (1986). The spreading hand autosegment of American Sign Language. Sign Language Studies, 50, 1–28. DOI: http://doi.org/10.1353/sls.1986.0006
Sandler, W. (1993). A sonority cycle in American Sign Language. Phonology, 10(2), 243–279. DOI: http://doi.org/10.1017/S0952675700000051
Santoro, M. (2018). Compounds in sign languages: The case of Italian and French Sign Language (PhD Thesis, EHESS, Paris). Retrieved 2019-09-03, from http://www.theses.fr/s106676
Slis, A. (2018). Articulatory variability and speech errors: An overview. Toronto Working Papers in Linguistics, 40.
Stokoe, W. C. (2005). Sign language structure: An outline of the visual communication systems of the American deaf. Journal of Deaf Studies and Deaf Education, 10(1), 3–37. DOI: http://doi.org/10.1093/deafed/eni001
Tartter, V. C., & Fischer, S. D. (1982). Perceiving minimal distinctions in ASL under normal and point-light display conditions. Perception & Psychophysics, 32(4), 327–334. DOI: http://doi.org/10.3758/BF03206238
Team, R. C. (2018). R version 3.5. 1 (Feather Spray): A language and environment for statistical computing. R Foundation for Statistical Computing, Vienna, Austria. URL https://www.r-project.org.
Thompson, R., Emmorey, K., & Gollan, T. H. (2005). “Tip of the Fingers” Experiences by Deaf Signers: Insights Into the Organization of a Sign-Based Lexicon. Psychological Science, 16(11), 856–860. DOI: http://doi.org/10.1111/j.1467-9280.2005.01626.x
Trubetzkoy, N. S. (1969). Principles of phonology. Berkeley: University of California Press.
van der Hulst, H. (1993). Units in the Analysis of Signs. Phonology, 10(2), 209–241. DOI: http://doi.org/10.1017/S095267570000004X
van der Hulst, H. (2020). Principles of Radical CV Phonology: A theory of segmental and syllabic structure. Edinburgh University Press Limited.
van der Hulst, H., & van der Kooij, E. (2021). Sign language phonology – theoretical perspectives. In J. Quer Villanueva, R. Pfau & A. Herrmann (Eds.), The Routledge Handbook of Theoretical and Experimental Sign Language Research (pp. 1–33). Routledge. DOI: http://doi.org/10.4324/9781315754499-1
Wells-Jensen, S. (2007). A cross-linguistic speech error investigation of functional complexity. Journal of Psycholinguistic Research, 36(2), 107–157. DOI: http://doi.org/10.1007/s10936-006-9036-5
Wongpakaran, N., Wongpakaran, T., Wedding, D., & Gwet, K. L. (2013). A comparison of Cohen’s Kappa and Gwet’s AC1 when calculating inter-rater reliability coefficients: a study conducted with personality disorder samples. BMC medical research methodology, 13(1), 1–7. DOI: http://doi.org/10.1186/1471-2288-13-61

